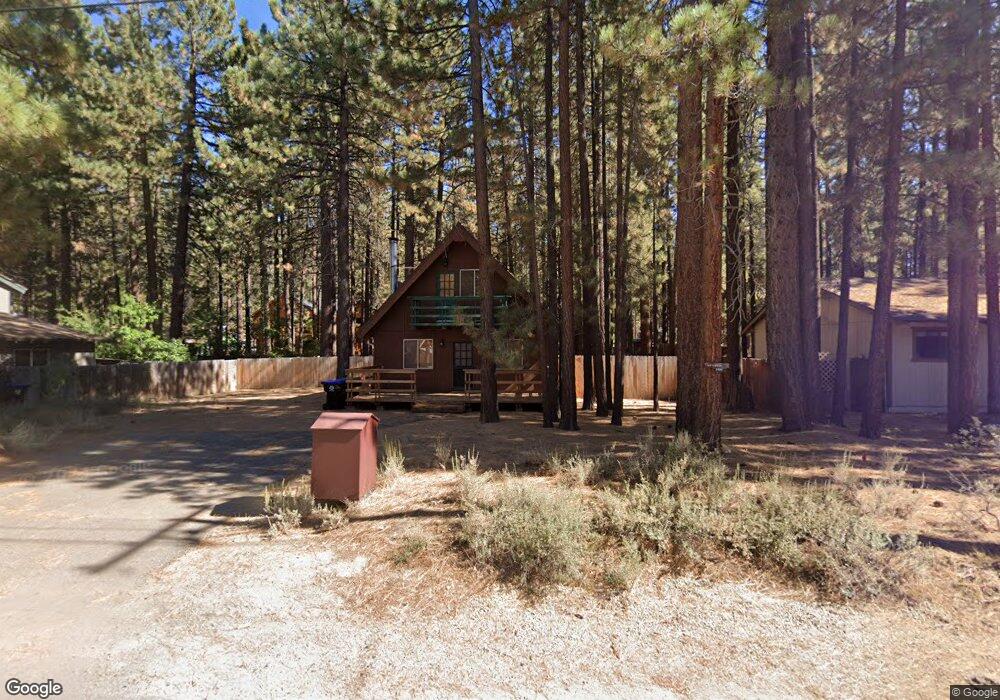
3380 Hobart Rd South Lake Tahoe, CA 96150
Estimated Value: $465,000 - $662,000
4
Beds
2
Baths
1,364
Sq Ft
$420/Sq Ft
Est. Value
About This Home
This home is located at 3380 Hobart Rd, South Lake Tahoe, CA 96150 and is currently estimated at $573,526, approximately $420 per square foot. 3380 Hobart Rd is a home located in El Dorado County with nearby schools including Bijou Community, South Tahoe Middle School, and South Tahoe High School.
Ownership History
Date
Name
Owned For
Owner Type
Purchase Details
Closed on
Oct 11, 2021
Sold by
Stewart Swanton Robert
Bought by
Swanton Family Trust
Current Estimated Value
Purchase Details
Closed on
Oct 5, 2021
Sold by
Swanton Marilou E and Swanton Family Trust
Bought by
Liewer Richard Walter and Liewer Christine Marie
Purchase Details
Closed on
Dec 3, 2007
Sold by
Swanton Robert S and Swanton Marilou E
Bought by
Swanton Robert S and Swanton Marilou E
Purchase Details
Closed on
Apr 15, 2003
Sold by
Liewer Richard W and Liewer Christine
Bought by
Liewer Richard Walter and Liewer Christine Marie
Purchase Details
Closed on
Jan 18, 2000
Sold by
Liewer Walter & Lucille Tr
Bought by
Liewer Richard W and Liewer Christine
Purchase Details
Closed on
May 22, 1999
Sold by
Liewer Walter & Lucille Tr
Bought by
Liewer Richard W and Liewer Christine
Create a Home Valuation Report for This Property
The Home Valuation Report is an in-depth analysis detailing your home's value as well as a comparison with similar homes in the area
Home Values in the Area
Average Home Value in this Area
Purchase History
| Date | Buyer | Sale Price | Title Company |
|---|---|---|---|
| Swanton Family Trust | -- | -- | |
| Liewer Richard Walter | $250,000 | None Available | |
| Swanton Robert S | -- | None Available | |
| Liewer Richard Walter | -- | -- | |
| Liewer Richard W | -- | -- | |
| Liewer Walter W | -- | -- | |
| Liewer Richard W | -- | -- | |
| Liewer Walter W | -- | -- |
Source: Public Records
Tax History Compared to Growth
Tax History
| Year | Tax Paid | Tax Assessment Tax Assessment Total Assessment is a certain percentage of the fair market value that is determined by local assessors to be the total taxable value of land and additions on the property. | Land | Improvement |
|---|---|---|---|---|
| 2025 | $3,602 | $337,605 | $73,669 | $263,936 |
| 2024 | $3,602 | $330,986 | $72,225 | $258,761 |
| 2023 | $3,539 | $324,497 | $70,809 | $253,688 |
| 2022 | $3,505 | $318,135 | $69,421 | $248,714 |
| 2021 | $940 | $78,295 | $10,852 | $67,443 |
| 2020 | $927 | $77,493 | $10,741 | $66,752 |
| 2019 | $922 | $75,975 | $10,531 | $65,444 |
| 2018 | $903 | $74,486 | $10,325 | $64,161 |
| 2017 | $890 | $73,026 | $10,123 | $62,903 |
| 2016 | $873 | $71,595 | $9,925 | $61,670 |
| 2015 | $864 | $70,522 | $9,777 | $60,745 |
| 2014 | $831 | $69,143 | $9,587 | $59,556 |
Source: Public Records
Map
Nearby Homes
- 1351 Gilmore Lake Rd
- 1351 Susie Lake Rd
- 1304 Susie Lake Rd
- 3510 Rancho Cir
- 1442 Price Rd
- 3740 Blackwood Rd Unit 42
- 3740 Blackwood Rd Unit 55
- 3740 Blackwood Rd Unit 61
- 3740 Blackwood Rd Unit 32
- 1309 Peninsula Rd
- 1291 Peninsula Rd
- 1201 Glenwood Way
- 3511 Bode Dr
- 3567 Saddle Rd
- 3546 Spruce Ave
- 3715 Blackwood Rd
- 1410 Ski Run Blvd Unit 28
- 1410 Ski Run Blvd Unit 16
- 1412 Ski Run Blvd
- 3596 Terry Ln Unit 45
- 3372 Hobart Rd
- 3386 Hobart Rd
- 3373 Aloha Rd
- 3392 Hobart Rd
- 3375 Hobart Rd
- 3387 Aloha Rd
- 3376 Woodland Rd
- 3371 Hobart Rd
- 3384 Woodland Rd
- 3393 Aloha Rd
- 3358 Hobart Rd
- 3364 Woodland Rd
- 3390 Woodland Rd
- 3399 Aloha Rd
- 3356 Woodland Rd
- 3396 Woodland Rd
- 3354 Hobart Rd
- 3406 Hobart Rd
- 3350 Woodland Rd
- 3404 Woodland Rd