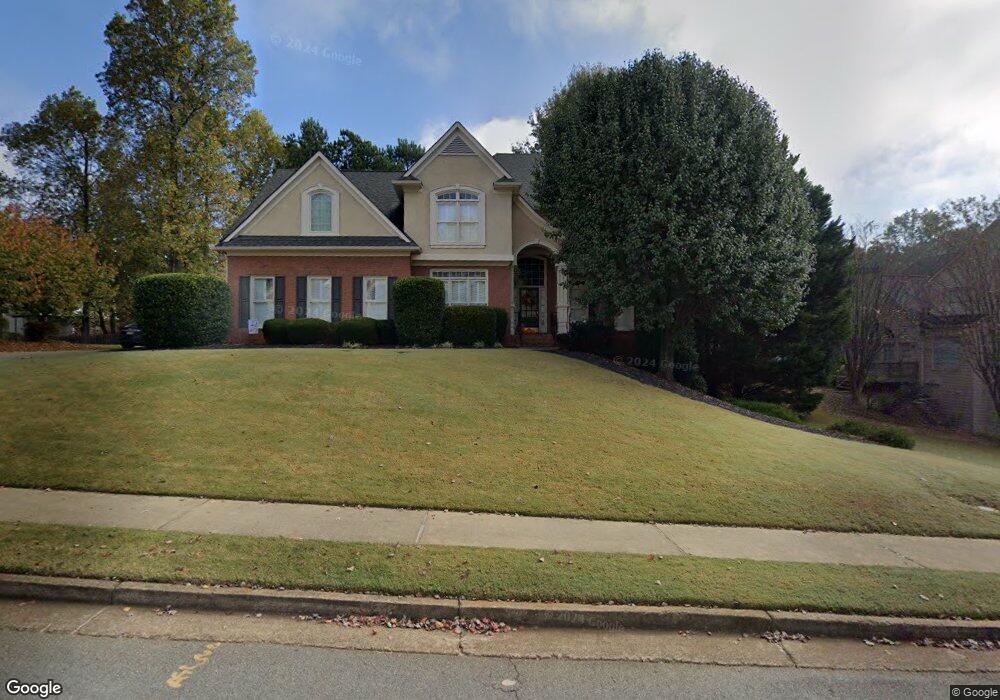
3380 Saxony Glen Unit A3 Marietta, GA 30066
Sandy Plains NeighborhoodEstimated Value: $968,000 - $1,050,000
4
Beds
5
Baths
3,334
Sq Ft
$302/Sq Ft
Est. Value
About This Home
This home is located at 3380 Saxony Glen Unit A3, Marietta, GA 30066 and is currently estimated at $1,006,691, approximately $301 per square foot. 3380 Saxony Glen Unit A3 is a home located in Cobb County with nearby schools including Mountain View Elementary School, Simpson Middle School, and Lassiter High School.
Ownership History
Date
Name
Owned For
Owner Type
Purchase Details
Closed on
Dec 16, 2024
Sold by
Engle Richard and Engle Nancy
Bought by
N And C Engle Living Trust and Engle
Current Estimated Value
Purchase Details
Closed on
Dec 16, 2002
Sold by
Engle Nancy
Bought by
Engle Richard and Engle Nancy
Home Financials for this Owner
Home Financials are based on the most recent Mortgage that was taken out on this home.
Original Mortgage
$272,000
Interest Rate
6.1%
Mortgage Type
New Conventional
Purchase Details
Closed on
Jul 31, 2001
Sold by
Carter John F and Carter Lillian
Bought by
Engle Richard and Engle Nancy
Home Financials for this Owner
Home Financials are based on the most recent Mortgage that was taken out on this home.
Original Mortgage
$270,000
Interest Rate
7.09%
Mortgage Type
New Conventional
Purchase Details
Closed on
Dec 31, 1996
Sold by
John Wieland Homes
Bought by
Carter John F Lillian
Create a Home Valuation Report for This Property
The Home Valuation Report is an in-depth analysis detailing your home's value as well as a comparison with similar homes in the area
Home Values in the Area
Average Home Value in this Area
Purchase History
| Date | Buyer | Sale Price | Title Company |
|---|---|---|---|
| N And C Engle Living Trust | -- | None Listed On Document | |
| Engle Richard | -- | -- | |
| Engle Richard | $420,000 | -- | |
| Carter John F Lillian | $304,900 | -- |
Source: Public Records
Mortgage History
| Date | Status | Borrower | Loan Amount |
|---|---|---|---|
| Previous Owner | Engle Richard | $272,000 | |
| Previous Owner | Engle Richard | $270,000 | |
| Closed | Carter John F Lillian | $0 |
Source: Public Records
Tax History Compared to Growth
Tax History
| Year | Tax Paid | Tax Assessment Tax Assessment Total Assessment is a certain percentage of the fair market value that is determined by local assessors to be the total taxable value of land and additions on the property. | Land | Improvement |
|---|---|---|---|---|
| 2025 | $2,001 | $335,108 | $80,000 | $255,108 |
| 2024 | $2,008 | $335,108 | $80,000 | $255,108 |
| 2023 | $1,754 | $319,024 | $70,000 | $249,024 |
| 2022 | $1,743 | $246,556 | $54,400 | $192,156 |
| 2021 | $1,743 | $246,556 | $54,400 | $192,156 |
| 2020 | $1,668 | $221,504 | $54,400 | $167,104 |
| 2019 | $1,693 | $229,804 | $54,400 | $175,404 |
| 2018 | $1,693 | $229,804 | $54,400 | $175,404 |
| 2017 | $1,444 | $207,352 | $50,000 | $157,352 |
| 2016 | $5,183 | $207,352 | $50,000 | $157,352 |
| 2015 | $5,125 | $199,964 | $60,000 | $139,964 |
| 2014 | $5,158 | $199,964 | $0 | $0 |
Source: Public Records
Map
Nearby Homes
- 3465 Staci Ct NE
- 2415 Wistful Way
- 2591 Sandy Dr
- 2403 Wistful Way
- 2477 Bobbie Dr
- 3283 Holly Springs Rd NE
- 3505 Bonaire Ct
- 2427 Camata Place
- 2867 Holly Oaks Dr
- 3150 Trickum Rd NE Unit LOT 1
- 3150 Trickum Rd NE
- 2864 Holly Oaks Dr
- 3061 Sandy Plains Rd
- 3090 Trickum Rd NE
- 3663 Heatherwood Dr NE
- 3060 Sandy Plains Rd
- 3122 Vandiver Dr
- 3382 Saxony Glen
- 2769 Carillon Crossing Unit A1
- 2771 Carillon Crossing
- 2800 Cranmore Ct
- 0 Saxony Glen Dr Unit 8724001
- 0 Saxony Glen Dr Unit 3129341
- 0 Saxony Glen Dr Unit 3209337
- 0 Saxony Glen Dr Unit 7490345
- 0 Saxony Glen Dr Unit 8579944
- 0 Saxony Glen Dr
- 3381 Saxony Glen
- 3379 Saxony Glen
- 3384 Saxony Glen
- 2801 Cranmore Ct Unit B3
- 2802 Cranmore Ct
- 3383 Saxony Glen
- 3377 Saxony Glen
- 2770 Carillon Crossing
- 3386 Saxony Glen
- 2775 Carillon Crossing