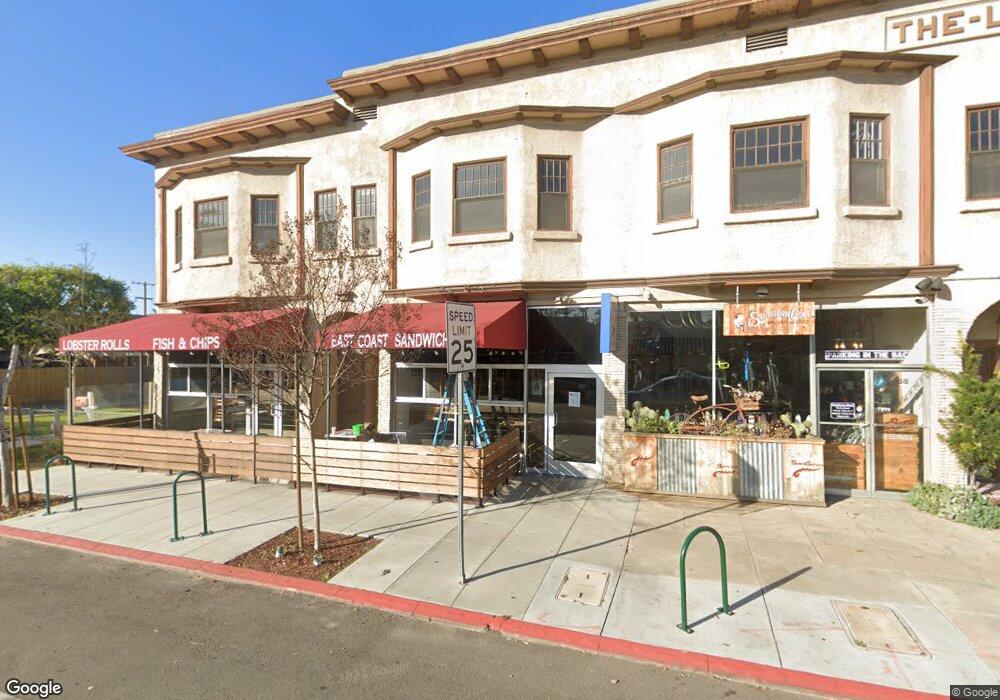
3382 3382 30th St San Diego, CA 92104
North Park Neighborhood
--
Bed
--
Bath
12,030
Sq Ft
0.29
Acres
About This Home
This home is located at 3382 3382 30th St, San Diego, CA 92104. 3382 3382 30th St is a home located in San Diego County with nearby schools including Jefferson Elementary, Roosevelt International Middle School, and Mcgill School Of Success.
Ownership History
Date
Name
Owned For
Owner Type
Purchase Details
Closed on
Mar 3, 2022
Sold by
M Rust Rawnsley Trust
Bought by
3396 30Th Street Llc
Home Financials for this Owner
Home Financials are based on the most recent Mortgage that was taken out on this home.
Original Mortgage
$4,256,000
Outstanding Balance
$3,976,476
Interest Rate
3.92%
Mortgage Type
New Conventional
Purchase Details
Closed on
Aug 20, 2021
Sold by
Rust Rawnsley Mackall
Bought by
M Rust Rawnsley Trust
Create a Home Valuation Report for This Property
The Home Valuation Report is an in-depth analysis detailing your home's value as well as a comparison with similar homes in the area
Home Values in the Area
Average Home Value in this Area
Purchase History
| Date | Buyer | Sale Price | Title Company |
|---|---|---|---|
| 3396 30Th Street Llc | $6,400,000 | Chicago Title | |
| M Rust Rawnsley Trust | -- | -- |
Source: Public Records
Mortgage History
| Date | Status | Borrower | Loan Amount |
|---|---|---|---|
| Open | 3396 30Th Street Llc | $4,256,000 |
Source: Public Records
Tax History Compared to Growth
Tax History
| Year | Tax Paid | Tax Assessment Tax Assessment Total Assessment is a certain percentage of the fair market value that is determined by local assessors to be the total taxable value of land and additions on the property. | Land | Improvement |
|---|---|---|---|---|
| 2025 | $71,446 | $5,624,402 | $2,653,020 | $2,971,382 |
| 2024 | $71,446 | $5,514,120 | $2,601,000 | $2,913,120 |
| 2023 | $69,783 | $5,406,000 | $2,550,000 | $2,856,000 |
| 2022 | $15,020 | $957,196 | $499,899 | $457,297 |
| 2021 | $14,288 | $938,429 | $490,098 | $448,331 |
| 2020 | $14,141 | $928,807 | $485,073 | $443,734 |
| 2019 | $13,930 | $910,596 | $475,562 | $435,034 |
| 2018 | $13,186 | $892,742 | $466,238 | $426,504 |
| 2017 | $83 | $875,239 | $457,097 | $418,142 |
| 2016 | $10,415 | $858,079 | $448,135 | $409,944 |
| 2015 | $10,258 | $845,191 | $441,404 | $403,787 |
| 2014 | $10,098 | $828,636 | $432,758 | $395,878 |
Source: Public Records
Map
Nearby Homes