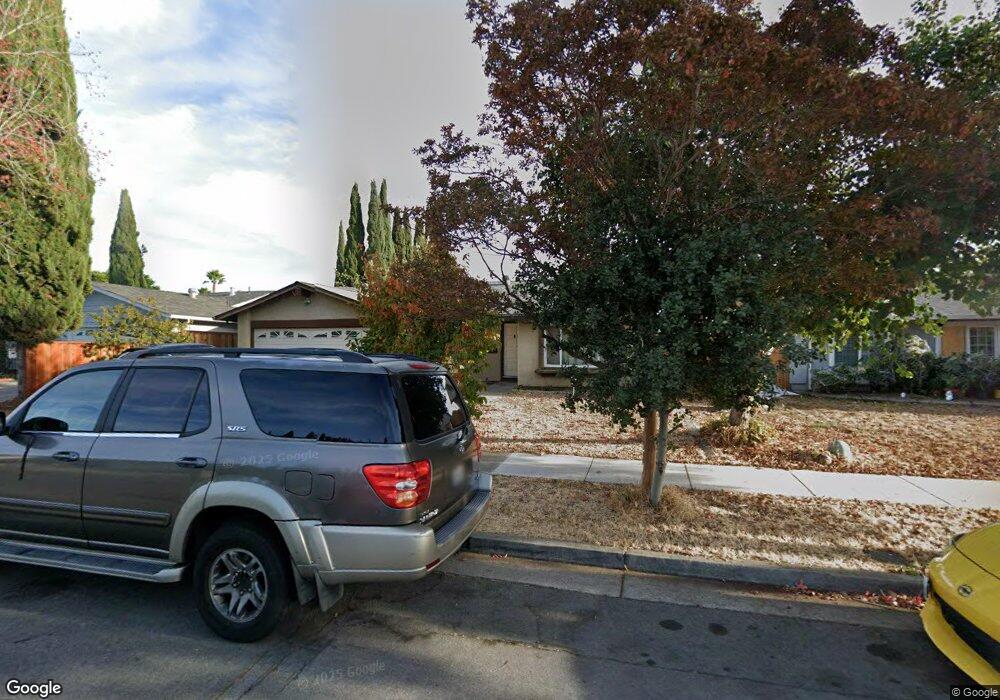
3382 Lucian Ave San Jose, CA 95127
East Foothills NeighborhoodEstimated Value: $1,145,000 - $1,262,205
4
Beds
2
Baths
1,554
Sq Ft
$776/Sq Ft
Est. Value
About This Home
This home is located at 3382 Lucian Ave, San Jose, CA 95127 and is currently estimated at $1,206,551, approximately $776 per square foot. 3382 Lucian Ave is a home located in Santa Clara County with nearby schools including Millard Mccollam Elementary School, William Sheppard Middle School, and James Lick High School.
Ownership History
Date
Name
Owned For
Owner Type
Purchase Details
Closed on
Aug 24, 2005
Sold by
Levine Andrew H
Bought by
Levine Andrew H
Current Estimated Value
Home Financials for this Owner
Home Financials are based on the most recent Mortgage that was taken out on this home.
Original Mortgage
$290,000
Outstanding Balance
$151,851
Interest Rate
5.61%
Mortgage Type
New Conventional
Estimated Equity
$1,054,700
Purchase Details
Closed on
Jan 18, 2005
Sold by
Levine Andrew H
Bought by
Levine Andrew H
Purchase Details
Closed on
Nov 18, 1999
Sold by
Nicholas Valadez
Bought by
Levine Andrew H
Home Financials for this Owner
Home Financials are based on the most recent Mortgage that was taken out on this home.
Original Mortgage
$256,850
Interest Rate
7.5%
Create a Home Valuation Report for This Property
The Home Valuation Report is an in-depth analysis detailing your home's value as well as a comparison with similar homes in the area
Home Values in the Area
Average Home Value in this Area
Purchase History
| Date | Buyer | Sale Price | Title Company |
|---|---|---|---|
| Levine Andrew H | -- | Chicago Title | |
| Levine Andrew H | -- | -- | |
| Levine Andrew H | $342,500 | Stewart Title |
Source: Public Records
Mortgage History
| Date | Status | Borrower | Loan Amount |
|---|---|---|---|
| Open | Levine Andrew H | $290,000 | |
| Closed | Levine Andrew H | $256,850 |
Source: Public Records
Tax History Compared to Growth
Tax History
| Year | Tax Paid | Tax Assessment Tax Assessment Total Assessment is a certain percentage of the fair market value that is determined by local assessors to be the total taxable value of land and additions on the property. | Land | Improvement |
|---|---|---|---|---|
| 2025 | $8,922 | $526,395 | $236,839 | $289,556 |
| 2024 | $8,922 | $516,075 | $232,196 | $283,879 |
| 2023 | $8,725 | $505,957 | $227,644 | $278,313 |
| 2022 | $8,545 | $496,037 | $223,181 | $272,856 |
| 2021 | $8,222 | $486,311 | $218,805 | $267,506 |
| 2020 | $7,984 | $481,326 | $216,562 | $264,764 |
| 2019 | $7,736 | $471,889 | $212,316 | $259,573 |
| 2018 | $7,616 | $462,637 | $208,153 | $254,484 |
| 2017 | $7,625 | $453,567 | $204,072 | $249,495 |
| 2016 | $7,204 | $444,674 | $200,071 | $244,603 |
| 2015 | $7,197 | $437,995 | $197,066 | $240,929 |
| 2014 | $6,301 | $429,416 | $193,206 | $236,210 |
Source: Public Records
Map
Nearby Homes
- 3278 Faith Ct
- 292 N Cragmont Ave
- 274 Vista Ave
- 636 Gridley St
- 550 Toyon Ave Unit 8
- 3482 Golf Dr
- 207 N Claremont Ave
- 186 Mountain View Ave
- 0 Gordon Blvd Unit FR25034343
- 0 Gordon Blvd Unit 625465
- 0 Gordon Blvd Unit 231524
- 0 Gordon Blvd Unit SR23111317
- 3101 Starburst Ct
- 3972 Pepper Tree Ln
- 3425 San Pablo Ave
- 673 Kirk Glen Dr
- 693 Kirk Glen Dr
- 15018 San Pablo Ave
- 770 Tallent Ave
- 4155 Holly Dr
- 3388 Lucian Ave
- 3374 Lucian Ave
- 412 La Pala Place
- 3368 Lucian Ave
- 3396 Lucian Ave
- 435 Fenton St
- 416 La Pala Place
- 3385 Lucian Ave
- 3377 Lucian Ave
- 425 Fenton St
- 406 La Pala Place
- 3391 Lucian Ave
- 3371 Lucian Ave
- 3399 Lucian Ave
- 517 Mccollam Dr
- 402 La Pala Place
- 441 La Pala Dr
- 431 La Pala Dr
- 511 Mccollam Dr
- 421 La Pala Dr