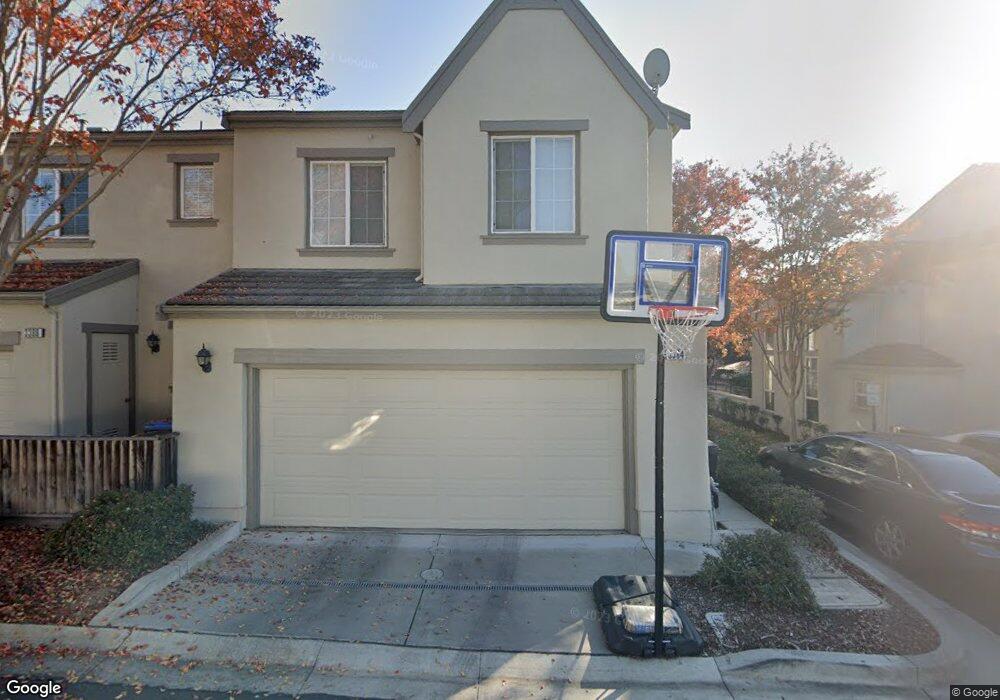
3384 Napoli Loop San Jose, CA 95135
Mirassou Vineyards NeighborhoodEstimated Value: $1,109,218 - $1,385,000
3
Beds
3
Baths
1,456
Sq Ft
$876/Sq Ft
Est. Value
About This Home
This home is located at 3384 Napoli Loop, San Jose, CA 95135 and is currently estimated at $1,275,555, approximately $876 per square foot. 3384 Napoli Loop is a home located in Santa Clara County with nearby schools including Tom Matsumoto Elementary School, Chaboya Middle School, and Evergreen Valley High School.
Ownership History
Date
Name
Owned For
Owner Type
Purchase Details
Closed on
May 2, 2025
Sold by
Lym Christopher Leonard and Liou Tina Tsu-E
Bought by
Christopher Lym And Tina Liou Living Trust and Lym
Current Estimated Value
Purchase Details
Closed on
Mar 9, 2011
Sold by
Lym Christopher L and Liou Tina T
Bought by
Lym Christopher L and Liou Tina T
Home Financials for this Owner
Home Financials are based on the most recent Mortgage that was taken out on this home.
Original Mortgage
$417,000
Interest Rate
4.75%
Mortgage Type
New Conventional
Purchase Details
Closed on
Apr 1, 2003
Sold by
Shapell Industries Inc
Bought by
Lym Chris L and Liou Tina T
Home Financials for this Owner
Home Financials are based on the most recent Mortgage that was taken out on this home.
Original Mortgage
$376,680
Interest Rate
5%
Mortgage Type
New Conventional
Create a Home Valuation Report for This Property
The Home Valuation Report is an in-depth analysis detailing your home's value as well as a comparison with similar homes in the area
Home Values in the Area
Average Home Value in this Area
Purchase History
| Date | Buyer | Sale Price | Title Company |
|---|---|---|---|
| Christopher Lym And Tina Liou Living Trust | -- | None Listed On Document | |
| Lym Christopher L | -- | Fidelity National Title Co | |
| Lym Chris L | $471,000 | Chicago Title |
Source: Public Records
Mortgage History
| Date | Status | Borrower | Loan Amount |
|---|---|---|---|
| Previous Owner | Lym Christopher L | $417,000 | |
| Previous Owner | Lym Chris L | $376,680 | |
| Closed | Lym Chris L | $47,000 |
Source: Public Records
Tax History Compared to Growth
Tax History
| Year | Tax Paid | Tax Assessment Tax Assessment Total Assessment is a certain percentage of the fair market value that is determined by local assessors to be the total taxable value of land and additions on the property. | Land | Improvement |
|---|---|---|---|---|
| 2025 | $10,642 | $681,854 | $217,239 | $464,615 |
| 2024 | $10,642 | $668,485 | $212,980 | $455,505 |
| 2023 | $10,422 | $655,378 | $208,804 | $446,574 |
| 2022 | $10,351 | $642,528 | $204,710 | $437,818 |
| 2021 | $10,156 | $629,931 | $200,697 | $429,234 |
| 2020 | $9,727 | $623,473 | $198,640 | $424,833 |
| 2019 | $9,476 | $611,249 | $194,746 | $416,503 |
| 2018 | $9,367 | $599,265 | $190,928 | $408,337 |
| 2017 | $9,211 | $587,516 | $187,185 | $400,331 |
| 2016 | $8,791 | $575,997 | $183,515 | $392,482 |
| 2015 | $8,670 | $567,346 | $180,759 | $386,587 |
| 2014 | $7,995 | $556,234 | $177,219 | $379,015 |
Source: Public Records
Map
Nearby Homes
- 3948 Mosher Dr
- 4121 Horizon Ln
- 3858 Evangelho Cir
- 3301 Villa Contessa Ct
- 4072 Bouquet Park Ln
- 4117 Pinot Gris Way
- 3422 Glenprosen Ct
- 4234 Chaboya Rd
- 3430 Maroun Place
- 3697 Jasmine Cir Unit 305
- 3642 Jasmine Cir Unit 3203
- 3508 Casabella Ct
- 3530 Jasmine Cir
- 3198 Vintage Crest Dr
- 3114 Pinot Grigio Place
- 3201 Vineyard Park Way
- 3034 Beckley Dr
- 0 Quimby Rd Unit 225125081
- 2604 Bon Dr
- 3123 Oakgate Way
- 3388 Napoli Loop
- 3380 Napoli Loop
- 3392 Napoli Loop
- 3376 Napoli Loop
- 3372 Napoli Loop
- 3389 Napoli Place
- 3385 Napoli Place
- 3381 Napoli Place
- 3377 Napoli Place
- 4229 Voltaire St
- 3368 Napoli Loop
- 4223 Voltaire St
- 3373 Napoli Place
- 4217 Voltaire St
- 4235 Voltaire St
- 4211 Voltaire St
- 4241 Voltaire St
- 3364 Napoli Loop
- 3369 Napoli Place
- 4247 Voltaire St