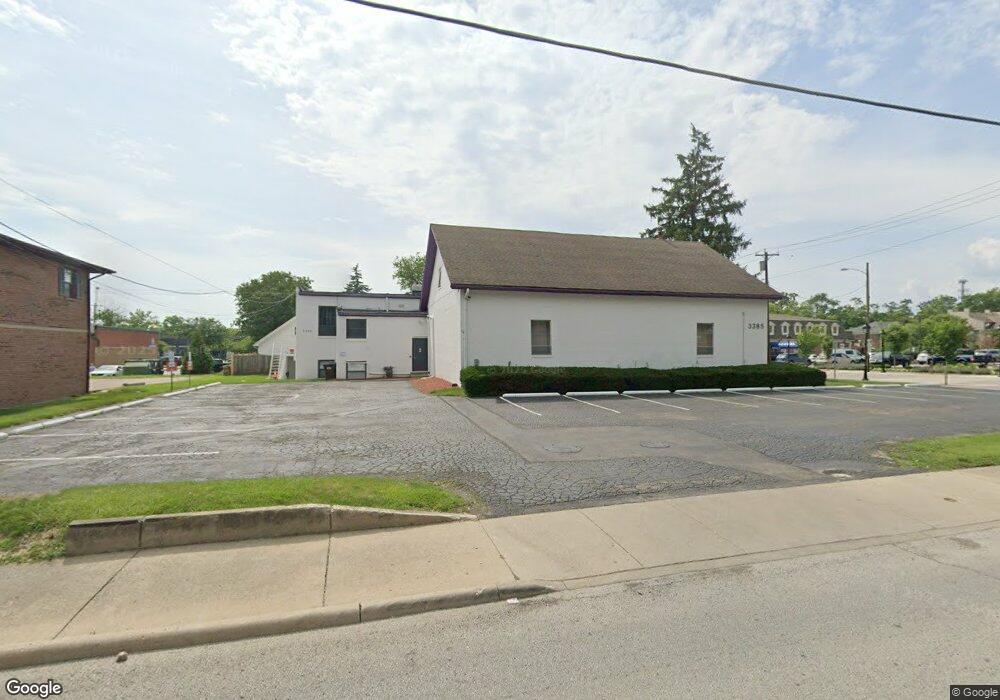
3385 Creek Rd Unit 101 Cincinnati, OH 45241
Estimated Value: $383,042
--
Bed
1
Bath
1,880
Sq Ft
$204/Sq Ft
Est. Value
About This Home
This home is located at 3385 Creek Rd Unit 101, Cincinnati, OH 45241 and is currently estimated at $383,042, approximately $203 per square foot. 3385 Creek Rd Unit 101 is a home located in Hamilton County with nearby schools including Sharonville Elementary School, Princeton Community Middle School, and Princeton High School.
Ownership History
Date
Name
Owned For
Owner Type
Purchase Details
Closed on
Nov 15, 2019
Sold by
Absbuilds Llc
Bought by
Storm Properties Llc
Current Estimated Value
Home Financials for this Owner
Home Financials are based on the most recent Mortgage that was taken out on this home.
Original Mortgage
$317,200
Interest Rate
3.6%
Mortgage Type
Future Advance Clause Open End Mortgage
Purchase Details
Closed on
Apr 14, 2016
Sold by
Saduly Llc
Bought by
Absbuilds Llc
Home Financials for this Owner
Home Financials are based on the most recent Mortgage that was taken out on this home.
Interest Rate
3.58%
Purchase Details
Closed on
Dec 15, 2004
Sold by
Braese Karl Heinz and Braese Grace Ellen
Bought by
Saduly Llc
Purchase Details
Closed on
Feb 3, 2004
Sold by
Braese Karl Heinz and Braese Grace
Bought by
Braese Karl Heinz and Braese Grace Ellen
Purchase Details
Closed on
Apr 1, 1998
Sold by
Reynolds Patricia A and Reynolds Terence S
Bought by
Braese Karl Heinz
Create a Home Valuation Report for This Property
The Home Valuation Report is an in-depth analysis detailing your home's value as well as a comparison with similar homes in the area
Home Values in the Area
Average Home Value in this Area
Purchase History
| Date | Buyer | Sale Price | Title Company |
|---|---|---|---|
| Storm Properties Llc | $239,400 | None Available | |
| Absbuilds Llc | $180,000 | -- | |
| Saduly Llc | -- | -- | |
| Braese Karl Heinz | -- | -- | |
| Braese Karl Heinz | $240,000 | L & D Title Agency Inc |
Source: Public Records
Mortgage History
| Date | Status | Borrower | Loan Amount |
|---|---|---|---|
| Closed | Storm Properties Llc | $317,200 | |
| Previous Owner | Absbuilds Llc | -- |
Source: Public Records
Tax History Compared to Growth
Tax History
| Year | Tax Paid | Tax Assessment Tax Assessment Total Assessment is a certain percentage of the fair market value that is determined by local assessors to be the total taxable value of land and additions on the property. | Land | Improvement |
|---|---|---|---|---|
| 2024 | $6,948 | $102,330 | $37,443 | $64,887 |
| 2023 | $6,810 | $102,330 | $37,443 | $64,887 |
| 2022 | $7,081 | $96,597 | $38,238 | $58,359 |
| 2021 | $7,032 | $96,597 | $38,238 | $58,359 |
| 2020 | $6,902 | $96,597 | $38,238 | $58,359 |
| 2019 | $7,360 | $63,000 | $35,735 | $27,265 |
| 2018 | $4,573 | $63,000 | $35,735 | $27,265 |
| 2017 | $4,404 | $63,000 | $35,735 | $27,265 |
| 2016 | $6,271 | $89,635 | $34,664 | $54,971 |
| 2015 | $6,302 | $89,635 | $34,664 | $54,971 |
| 2014 | $6,301 | $89,635 | $34,664 | $54,971 |
| 2013 | $6,272 | $92,407 | $35,735 | $56,672 |
Source: Public Records
Map
Nearby Homes
- 3380 Spurrier Ln
- 3706 Verbena Dr
- 10816 Thornview Dr
- 10914 Lemarie Dr
- 10788 Thornview Dr
- 10775 Lemarie Dr
- 4036 Haverstraw Dr
- 4194 Beavercreek Cir
- 3590 Glendale Milford Rd
- 4051 Falling Creek Ct
- 10480 Wintergreen Ct
- 4170 Cornell Rd
- 3706 Glendale Milford Rd
- 10369 Arborhill Ln
- 3756 Glendale Milford Rd
- 3816 Glendale Milford Rd
- 10301 Giverny Blvd
- 4071 E Kemper Rd
- 4254 Fox Hollow Dr
- 3875 Hauck Rd