Estimated Value: $451,000 - $538,000
3
Beds
3
Baths
2,075
Sq Ft
$236/Sq Ft
Est. Value
About This Home
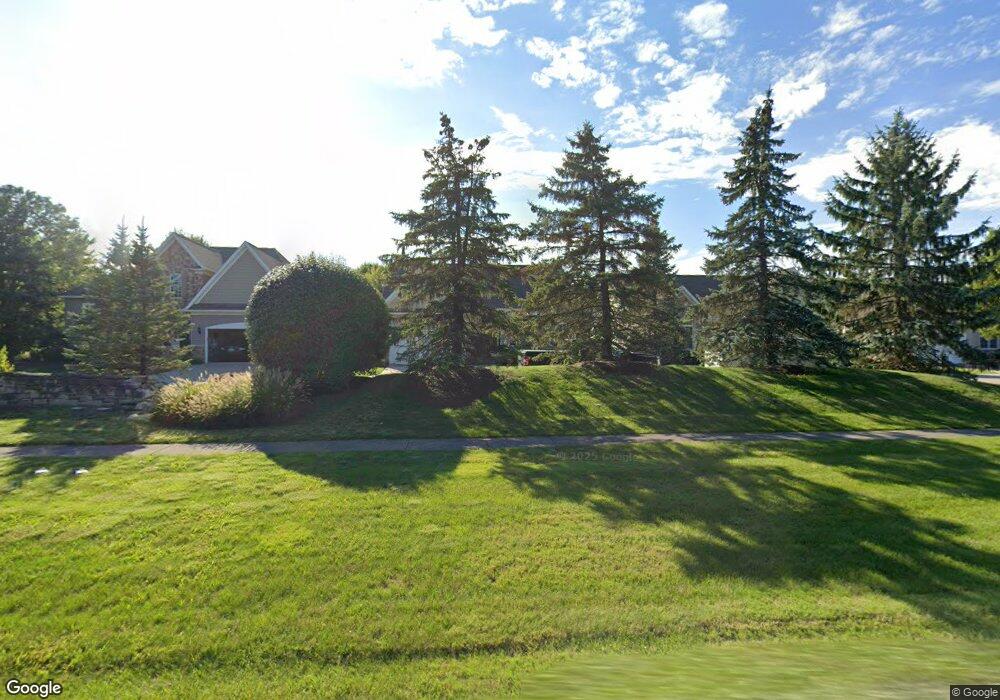
This home is located at 3386 Nagel Rd, Avon, OH 44011 and is currently estimated at $490,251, approximately $236 per square foot. 3386 Nagel Rd is a home located in Lorain County with nearby schools including Avon East Elementary School, Avon Heritage South Elementary School, and Avon Middle School.
Ownership History
Date
Name
Owned For
Owner Type
Purchase Details
Closed on
Oct 30, 2024
Sold by
Obrien Lori A and Walbom Brad Eric
Bought by
Obrien Lori A and Walbom Brad Eric
Current Estimated Value
Purchase Details
Closed on
May 22, 2007
Sold by
Schafer Development Co Inc
Bought by
Obrien Lori A
Home Financials for this Owner
Home Financials are based on the most recent Mortgage that was taken out on this home.
Original Mortgage
$200,000
Interest Rate
6.22%
Mortgage Type
Purchase Money Mortgage
Purchase Details
Closed on
Feb 16, 2005
Sold by
Cottage Gate Estates Ltd
Bought by
Schafer Development Co Inc
Home Financials for this Owner
Home Financials are based on the most recent Mortgage that was taken out on this home.
Original Mortgage
$6,000,000
Interest Rate
5.78%
Mortgage Type
Credit Line Revolving
Create a Home Valuation Report for This Property
The Home Valuation Report is an in-depth analysis detailing your home's value as well as a comparison with similar homes in the area
Home Values in the Area
Average Home Value in this Area
Purchase History
| Date | Buyer | Sale Price | Title Company |
|---|---|---|---|
| Obrien Lori A | -- | None Listed On Document | |
| Obrien Lori A | $298,000 | Old Republic | |
| Schafer Development Co Inc | $560,000 | Lorain County Title Co Inc |
Source: Public Records
Mortgage History
| Date | Status | Borrower | Loan Amount |
|---|---|---|---|
| Previous Owner | Obrien Lori A | $200,000 | |
| Previous Owner | Schafer Development Co Inc | $6,000,000 |
Source: Public Records
Tax History Compared to Growth
Tax History
| Year | Tax Paid | Tax Assessment Tax Assessment Total Assessment is a certain percentage of the fair market value that is determined by local assessors to be the total taxable value of land and additions on the property. | Land | Improvement |
|---|---|---|---|---|
| 2024 | $6,783 | $137,984 | $29,750 | $108,234 |
| 2023 | $6,407 | $115,826 | $27,685 | $88,141 |
| 2022 | $6,347 | $115,826 | $27,685 | $88,141 |
| 2021 | $6,360 | $115,826 | $27,685 | $88,141 |
| 2020 | $5,997 | $102,500 | $24,500 | $78,000 |
| 2019 | $5,874 | $102,500 | $24,500 | $78,000 |
| 2018 | $5,361 | $102,500 | $24,500 | $78,000 |
| 2017 | $5,279 | $92,620 | $23,630 | $68,990 |
| 2016 | $5,341 | $92,620 | $23,630 | $68,990 |
| 2015 | $5,394 | $92,620 | $23,630 | $68,990 |
| 2014 | $5,349 | $92,620 | $23,630 | $68,990 |
| 2013 | $5,378 | $92,620 | $23,630 | $68,990 |
Source: Public Records
Map
Nearby Homes
- 33709 Vineyard Park
- 33695 Schwartz Rd
- 3215 Nagel Rd
- 33423 Augusta Way
- 34004 Hickory Ct
- 3181 Jaycox Rd
- 34022 Hickory Ct
- Scottsdale Plan at The Reserve at Mass Estates - Estate Series
- Rockport Plan at The Reserve at Mass Estates - Estate Series
- Rivendale Plan at The Reserve at Mass Estates - Estate Series
- Mayfield Plan at The Reserve at Mass Estates - Estate Series
- Kensington Plan at The Reserve at Mass Estates - Estate Series
- Aspen Plan at The Reserve at Mass Estates - Estate Series
- 3402 Mass Dr
- BEDFORD Plan at Fieldstone Landings
- CRESTWOOD Plan at Fieldstone Landings
- VIOLA Plan at Fieldstone Landings
- CHAMP Plan at Fieldstone Landings
- SEBASTIAN Plan at Fieldstone Landings
- BRENNAN Plan at Fieldstone Landings
- 3382 Nagel Rd
- 3390 Nagel Rd
- 3370 Cottage Gate Unit Lot 6
- 3366 Cottage Gate Unit Lot 7
- 3366 Cottage Gate
- 3370 Cottage Gate
- 3378 Nagel Rd
- 3401 Vineyard Park
- 3399 Vineyard Park
- 3374 Nagel Rd
- 34 Nagel Rd Unit 34
- 5 Nagel Rd Unit V/L 5
- 5 Nagel Rd
- 3395 Vineyard Park
- 3370 Nagel S L #6 Rd
- 3370 Nagel Rd Unit S/L6
- 3384 Concord Cir
- 3366 Nagel Rd
- 3389 Vineyard Park
- 3376 Concord Cir