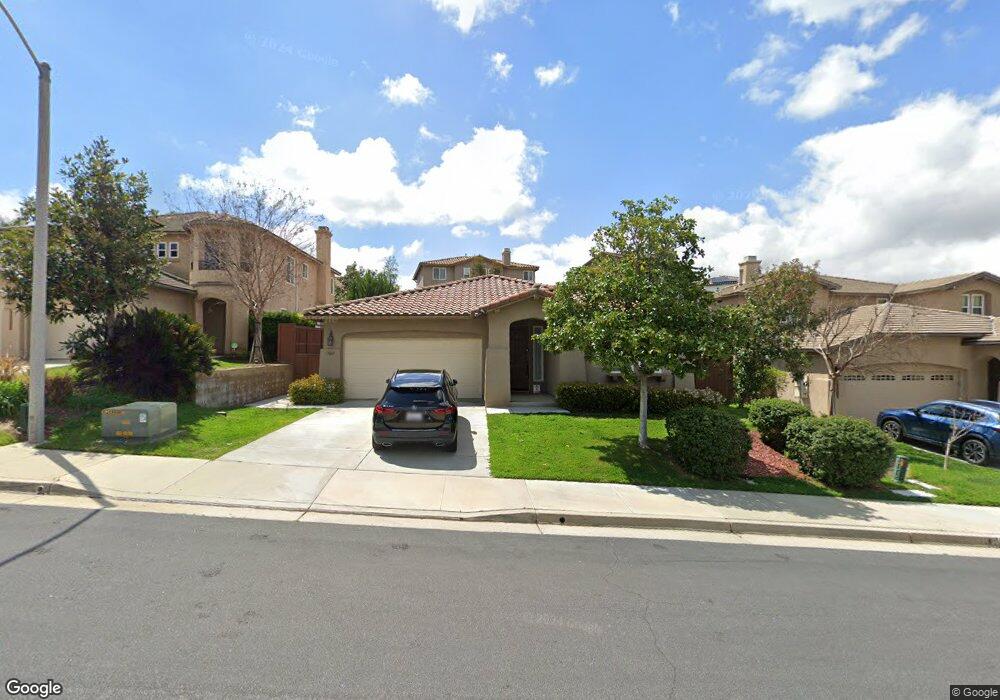
33867 Flora Springs St Temecula, CA 92592
Morgan Hill NeighborhoodEstimated Value: $724,000 - $785,000
3
Beds
2
Baths
2,056
Sq Ft
$370/Sq Ft
Est. Value
About This Home
This home is located at 33867 Flora Springs St, Temecula, CA 92592 and is currently estimated at $761,161, approximately $370 per square foot. 33867 Flora Springs St is a home located in Riverside County with nearby schools including Tony Tobin Elementary School, Vail Ranch Middle School, and Great Oak High School.
Ownership History
Date
Name
Owned For
Owner Type
Purchase Details
Closed on
Aug 24, 2022
Sold by
William Pelletier Robert and Bratche Carla
Bought by
Pelletier Family Trust
Current Estimated Value
Purchase Details
Closed on
Nov 8, 2005
Sold by
Combs Ronald T and Combs Dallahandria
Bought by
Pelletier Robert and Pelletier Carla
Home Financials for this Owner
Home Financials are based on the most recent Mortgage that was taken out on this home.
Original Mortgage
$320,000
Interest Rate
5.97%
Mortgage Type
Fannie Mae Freddie Mac
Purchase Details
Closed on
Jun 30, 2004
Sold by
Mcmillin Artessa Llc
Bought by
Combs Ronald T and Combs Dallahandria
Home Financials for this Owner
Home Financials are based on the most recent Mortgage that was taken out on this home.
Original Mortgage
$379,040
Interest Rate
6.37%
Mortgage Type
Purchase Money Mortgage
Create a Home Valuation Report for This Property
The Home Valuation Report is an in-depth analysis detailing your home's value as well as a comparison with similar homes in the area
Home Values in the Area
Average Home Value in this Area
Purchase History
| Date | Buyer | Sale Price | Title Company |
|---|---|---|---|
| Pelletier Family Trust | -- | None Listed On Document | |
| Pelletier Robert William | -- | None Listed On Document | |
| Pelletier Robert | $400,000 | Fidelity National Title | |
| Combs Ronald T | $399,000 | Fidelity National Title Co |
Source: Public Records
Mortgage History
| Date | Status | Borrower | Loan Amount |
|---|---|---|---|
| Previous Owner | Pelletier Robert | $320,000 | |
| Previous Owner | Combs Ronald T | $379,040 |
Source: Public Records
Tax History Compared to Growth
Tax History
| Year | Tax Paid | Tax Assessment Tax Assessment Total Assessment is a certain percentage of the fair market value that is determined by local assessors to be the total taxable value of land and additions on the property. | Land | Improvement |
|---|---|---|---|---|
| 2025 | $8,658 | $546,613 | $204,976 | $341,637 |
| 2023 | $8,658 | $525,389 | $197,017 | $328,372 |
| 2022 | $8,646 | $515,088 | $193,154 | $321,934 |
| 2021 | $8,170 | $504,989 | $189,367 | $315,622 |
| 2020 | $7,860 | $499,812 | $187,426 | $312,386 |
| 2019 | $7,766 | $490,012 | $183,751 | $306,261 |
| 2018 | $7,639 | $480,405 | $180,150 | $300,255 |
| 2017 | $7,509 | $470,986 | $176,618 | $294,368 |
| 2016 | $6,876 | $416,000 | $156,000 | $260,000 |
| 2015 | $7,022 | $402,000 | $151,000 | $251,000 |
| 2014 | $6,825 | $392,000 | $147,000 | $245,000 |
Source: Public Records
Map
Nearby Homes
- 33827 Flora Springs St
- 33888 Madrigal Ct
- 44839 Mumm St
- 45250 Oakville Ct
- 45098 Vine Cliff St
- 33919 Galleron St
- 33429 Barrington Dr
- 44607 Crestwood Cir
- 33710 Sattui St
- 33751 Abbey Rd
- 33763 Abbey Rd
- 44727 Calle Banuelos
- 45118 Riverstone Ct
- 34116 Galleron St
- 45106 Marsanne St
- 44364 Kingston Dr
- 33657 Emerson Way Unit C
- 33422 Scarborough Ln
- 44690 Calle Lopez
- 44822 Camino Alamosa
- 33877 Flora Springs St
- 33857 Flora Springs St
- 33887 Flora Springs St
- 33844 Pegase Ct
- 33837 Flora Springs St
- 33834 Pegase Ct
- 33854 Pegase Ct
- 33897 Flora Springs St
- 33864 Pegase Ct
- 33824 Pegase Ct
- 33862 Flora Springs St
- 33874 Pegase Ct
- 33872 Flora Springs St
- 33852 Flora Springs St
- 33907 Flora Springs St
- 33817 Flora Springs St
- 33882 Flora Springs St
- 33842 Flora Springs St
- 33884 Pegase Ct
- 33892 Flora Springs St