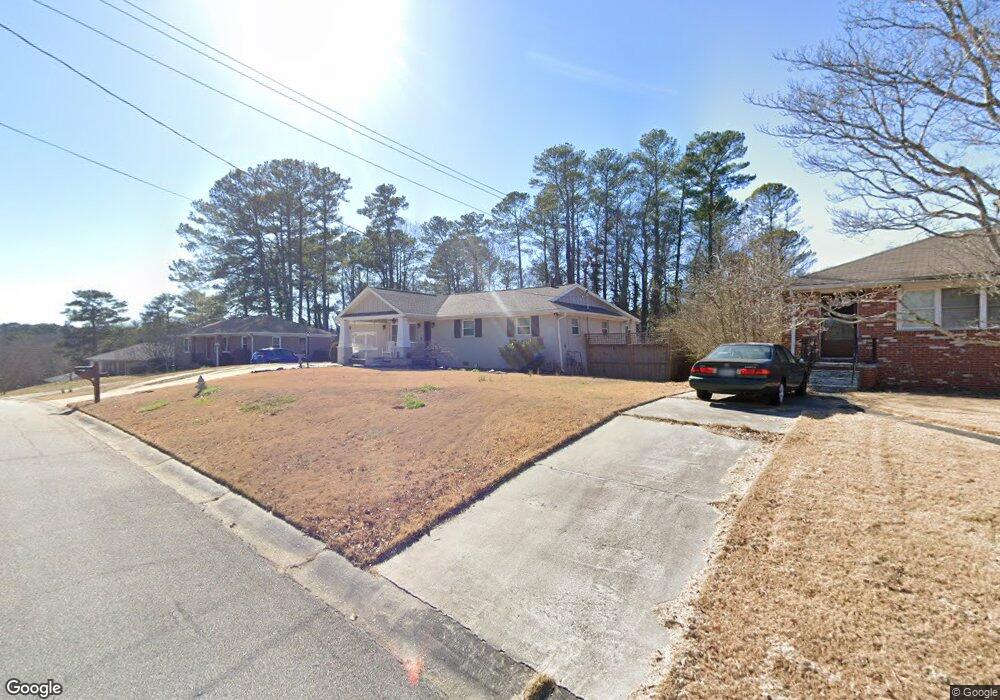
3387 Woodview Dr SE Smyrna, GA 30082
Estimated Value: $382,451 - $429,000
3
Beds
3
Baths
1,523
Sq Ft
$270/Sq Ft
Est. Value
About This Home
This home is located at 3387 Woodview Dr SE, Smyrna, GA 30082 and is currently estimated at $411,613, approximately $270 per square foot. 3387 Woodview Dr SE is a home located in Cobb County with nearby schools including Norton Park Elementary School, Griffin Middle School, and Campbell High School.
Ownership History
Date
Name
Owned For
Owner Type
Purchase Details
Closed on
Apr 5, 2019
Sold by
Rice Rhenna D
Bought by
Rice Rhenna D and Lutterbie Russell Richard
Current Estimated Value
Home Financials for this Owner
Home Financials are based on the most recent Mortgage that was taken out on this home.
Original Mortgage
$295,643
Outstanding Balance
$259,921
Interest Rate
4.4%
Mortgage Type
FHA
Estimated Equity
$151,692
Purchase Details
Closed on
Nov 25, 2009
Sold by
Naes Don
Bought by
Rice Rhenna D
Home Financials for this Owner
Home Financials are based on the most recent Mortgage that was taken out on this home.
Original Mortgage
$7,344
Interest Rate
4.98%
Purchase Details
Closed on
Oct 29, 2009
Sold by
Peymax Props Inc
Bought by
Naes Don
Home Financials for this Owner
Home Financials are based on the most recent Mortgage that was taken out on this home.
Original Mortgage
$7,344
Interest Rate
4.98%
Create a Home Valuation Report for This Property
The Home Valuation Report is an in-depth analysis detailing your home's value as well as a comparison with similar homes in the area
Home Values in the Area
Average Home Value in this Area
Purchase History
| Date | Buyer | Sale Price | Title Company |
|---|---|---|---|
| Rice Rhenna D | -- | -- | |
| Rice Rhenna D | $128,000 | -- | |
| Naes Don | $38,000 | -- |
Source: Public Records
Mortgage History
| Date | Status | Borrower | Loan Amount |
|---|---|---|---|
| Open | Rice Rhenna D | $295,643 | |
| Previous Owner | Rice Rhenna D | $7,344 |
Source: Public Records
Tax History Compared to Growth
Tax History
| Year | Tax Paid | Tax Assessment Tax Assessment Total Assessment is a certain percentage of the fair market value that is determined by local assessors to be the total taxable value of land and additions on the property. | Land | Improvement |
|---|---|---|---|---|
| 2025 | $925 | $183,784 | $26,000 | $157,784 |
| 2024 | $857 | $159,660 | $26,000 | $133,660 |
| 2023 | $598 | $142,008 | $19,200 | $122,808 |
| 2022 | $804 | $142,008 | $19,200 | $122,808 |
| 2021 | $668 | $96,416 | $16,800 | $79,616 |
| 2020 | $643 | $87,968 | $16,800 | $71,168 |
| 2019 | $2,001 | $82,712 | $16,000 | $66,712 |
| 2018 | $1,482 | $58,996 | $16,000 | $42,996 |
| 2017 | $1,412 | $58,996 | $16,000 | $42,996 |
| 2016 | $962 | $42,352 | $14,000 | $28,352 |
| 2015 | $757 | $34,516 | $12,000 | $22,516 |
| 2014 | $763 | $34,516 | $0 | $0 |
Source: Public Records
Map
Nearby Homes
- 3235 Woodview Dr SE
- 3158 Autumn Brook Trail SE
- 358 Nature Brook Walk SE
- 571 Norton Cir SE
- 54 Church Rd SE Unit 1
- 3418 Creek Valley Dr SE
- 3313 Hidden Trail Rd SE
- 2975 Nursery Rd SE
- 3175 Foxwood Trail SE
- 169 Hurt Dr SE
- 260 Diane Dr SE
- 117 Radford Cir SW
- 259 Diane Dr SE
- 166 Hurt Dr SE
- 3288 Old Concord Rd SE Unit 1
- 1007 Oaks Pkwy SE
- 118 Lucia Dr SE
- 3377 Woodview Dr SE Unit 2
- 3397 Woodview Dr SE
- 3386 Woodview Dr SE
- 234 Woodview Ln SE
- 3417 Woodview Dr SE
- 3367 Woodview Dr SE
- 3396 Woodview Dr SE
- 3376 Woodview Dr SE
- 226 Woodview Ln SE
- 3366 Woodview Dr SE
- 3347 Woodview Dr SE
- 3416 Woodview Dr SE Unit I
- 3327 Woodview Dr SE
- 253 Woodview Ln SE
- 3356 Woodview Dr SE
- 233 Woodview Ln SE Unit 1
- 263 Woodview Ln SE Unit 1
- 3317 Woodview Dr SE
- 271 Woodview Ln SE
- 3346 Woodview Dr SE Unit 2