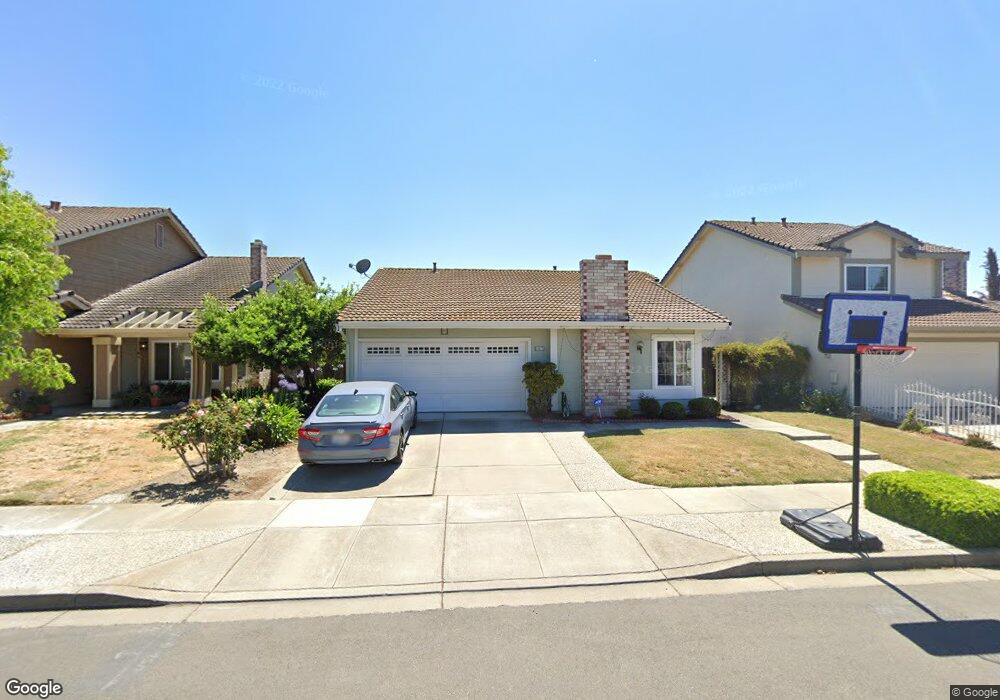
33875 Juliet Cir Fremont, CA 94555
Ardenwood NeighborhoodEstimated Value: $1,464,701 - $1,630,000
4
Beds
2
Baths
1,214
Sq Ft
$1,266/Sq Ft
Est. Value
About This Home
This home is located at 33875 Juliet Cir, Fremont, CA 94555 and is currently estimated at $1,537,425, approximately $1,266 per square foot. 33875 Juliet Cir is a home located in Alameda County with nearby schools including Ardenwood Elementary, Thornton Middle School, and American High School.
Ownership History
Date
Name
Owned For
Owner Type
Purchase Details
Closed on
May 21, 2018
Sold by
Patel Renuka
Bought by
Mathur Amit and Mathur Mahima
Current Estimated Value
Home Financials for this Owner
Home Financials are based on the most recent Mortgage that was taken out on this home.
Original Mortgage
$857,500
Outstanding Balance
$726,915
Interest Rate
3.75%
Mortgage Type
Adjustable Rate Mortgage/ARM
Estimated Equity
$810,510
Purchase Details
Closed on
Mar 1, 2000
Sold by
Patel Kiran K
Bought by
Patel Renuka
Purchase Details
Closed on
Aug 25, 1994
Sold by
Sampat Kiran C and Sampat Rekha K
Bought by
Patel Kiran K and Patel Renuka K
Home Financials for this Owner
Home Financials are based on the most recent Mortgage that was taken out on this home.
Original Mortgage
$164,000
Interest Rate
8.65%
Purchase Details
Closed on
Oct 20, 1993
Sold by
Sampat Kiran C and Sampat Rekha K
Bought by
Sampat Kiran C and Sampat Rekha K
Create a Home Valuation Report for This Property
The Home Valuation Report is an in-depth analysis detailing your home's value as well as a comparison with similar homes in the area
Home Values in the Area
Average Home Value in this Area
Purchase History
| Date | Buyer | Sale Price | Title Company |
|---|---|---|---|
| Mathur Amit | $1,050,000 | Wfg National Title Company | |
| Patel Renuka | -- | First American Title Ins Co | |
| Patel Kiran K | $205,000 | First American Title | |
| Sampat Kiran C | -- | -- |
Source: Public Records
Mortgage History
| Date | Status | Borrower | Loan Amount |
|---|---|---|---|
| Open | Mathur Amit | $857,500 | |
| Previous Owner | Patel Kiran K | $164,000 |
Source: Public Records
Tax History Compared to Growth
Tax History
| Year | Tax Paid | Tax Assessment Tax Assessment Total Assessment is a certain percentage of the fair market value that is determined by local assessors to be the total taxable value of land and additions on the property. | Land | Improvement |
|---|---|---|---|---|
| 2025 | $14,010 | $1,187,700 | $358,410 | $836,290 |
| 2024 | $14,010 | $1,164,274 | $351,382 | $819,892 |
| 2023 | $13,643 | $1,148,311 | $344,493 | $803,818 |
| 2022 | $13,479 | $1,118,798 | $337,739 | $788,059 |
| 2021 | $13,144 | $1,096,727 | $331,118 | $772,609 |
| 2020 | $13,224 | $1,092,420 | $327,726 | $764,694 |
| 2019 | $13,071 | $1,071,000 | $321,300 | $749,700 |
| 2018 | $4,150 | $302,616 | $90,785 | $211,831 |
| 2017 | $4,047 | $296,683 | $89,005 | $207,678 |
| 2016 | $3,969 | $290,867 | $87,260 | $203,607 |
| 2015 | $3,908 | $286,498 | $85,949 | $200,549 |
| 2014 | $3,834 | $280,888 | $84,266 | $196,622 |
Source: Public Records
Map
Nearby Homes
- 5301 Shamrock Common
- 4744 Touchstone Terrace
- 4512 Macbeth Ave
- 34198 Tony Terrace
- 34648 Musk Terrace
- 33018 Soquel St
- 34565 Pueblo Terrace
- 5220 Fairbanks Common
- 32945 Regents Blvd
- 4141 Deep Creek Rd Unit 137
- 34607 Pueblo Terrace
- 34627 Pueblo Terrace
- 5176 Tacoma Common
- 5308 Tacoma Common
- 34102 Zaner Way
- 4243 Nerissa Cir
- 5621 Via Lugano
- 34192 Firenze Terrace
- 34768 Swain Common
- 33064 Compton Ct
- 33879 Juliet Cir
- 33871 Juliet Cir
- 4968 Romeo Place
- 33867 Juliet Cir
- 4960 Romeo Place
- 4976 Romeo Place
- 33883 Juliet Cir
- 4984 Romeo Place
- 33890 Juliet Cir
- 33886 Juliet Cir
- 33894 Juliet Cir
- 4952 Romeo Place
- 33863 Juliet Cir
- 33898 Juliet Cir
- 33882 Juliet Cir
- 33859 Juliet Cir
- 33878 Juliet Cir
- 4946 Romeo Place
- 4977 Romeo Place
- 33902 Juliet Cir