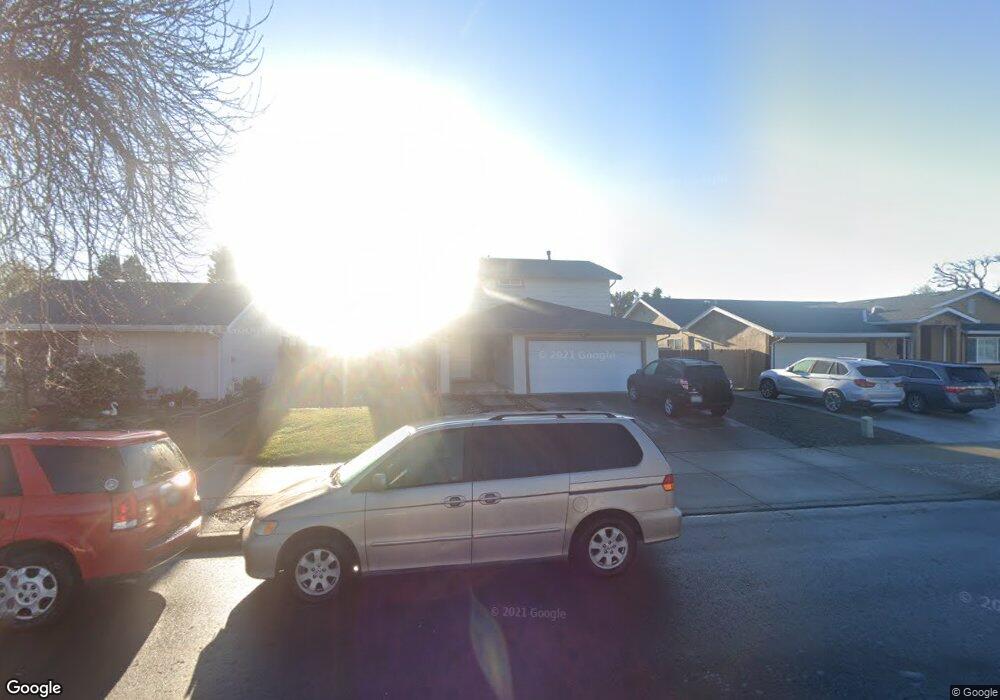
3388 Surry Place Fremont, CA 94536
Brookvale NeighborhoodEstimated Value: $1,872,000 - $2,082,000
4
Beds
3
Baths
1,980
Sq Ft
$983/Sq Ft
Est. Value
About This Home
This home is located at 3388 Surry Place, Fremont, CA 94536 and is currently estimated at $1,947,170, approximately $983 per square foot. 3388 Surry Place is a home located in Alameda County with nearby schools including Brookvale Elementary School, Thornton Middle School, and American High School.
Ownership History
Date
Name
Owned For
Owner Type
Purchase Details
Closed on
Sep 21, 2007
Sold by
King Leon and King Alfrida
Bought by
King Leon B and King Alfrida L
Current Estimated Value
Purchase Details
Closed on
Mar 8, 2002
Sold by
Lyou De Syang and Sun Feng I Chuan
Bought by
King Leon and King Alfrida
Home Financials for this Owner
Home Financials are based on the most recent Mortgage that was taken out on this home.
Original Mortgage
$485,000
Outstanding Balance
$201,599
Interest Rate
6.99%
Mortgage Type
Stand Alone First
Estimated Equity
$1,745,571
Purchase Details
Closed on
Jan 9, 1996
Sold by
Lyou De Syang
Bought by
Lyou De Syang and Sun Feng I Chuan
Home Financials for this Owner
Home Financials are based on the most recent Mortgage that was taken out on this home.
Original Mortgage
$150,000
Interest Rate
7.18%
Purchase Details
Closed on
Jan 13, 1994
Sold by
Lyou De Syang
Bought by
Lyou De Syang
Home Financials for this Owner
Home Financials are based on the most recent Mortgage that was taken out on this home.
Original Mortgage
$139,200
Interest Rate
4.62%
Create a Home Valuation Report for This Property
The Home Valuation Report is an in-depth analysis detailing your home's value as well as a comparison with similar homes in the area
Home Values in the Area
Average Home Value in this Area
Purchase History
| Date | Buyer | Sale Price | Title Company |
|---|---|---|---|
| King Leon B | -- | None Available | |
| King Leon | $485,000 | Alliance Title Company | |
| Lyou De Syang | -- | American Title Ins Co | |
| Lyou De Syang | -- | World Title Company |
Source: Public Records
Mortgage History
| Date | Status | Borrower | Loan Amount |
|---|---|---|---|
| Open | King Leon | $485,000 | |
| Previous Owner | Lyou De Syang | $150,000 | |
| Previous Owner | Lyou De Syang | $139,200 |
Source: Public Records
Tax History Compared to Growth
Tax History
| Year | Tax Paid | Tax Assessment Tax Assessment Total Assessment is a certain percentage of the fair market value that is determined by local assessors to be the total taxable value of land and additions on the property. | Land | Improvement |
|---|---|---|---|---|
| 2025 | $8,699 | $709,441 | $214,932 | $501,509 |
| 2024 | $8,699 | $695,395 | $210,718 | $491,677 |
| 2023 | $8,461 | $688,627 | $206,588 | $482,039 |
| 2022 | $8,346 | $668,124 | $202,537 | $472,587 |
| 2021 | $8,142 | $654,888 | $198,566 | $463,322 |
| 2020 | $8,148 | $655,103 | $196,531 | $458,572 |
| 2019 | $8,055 | $642,260 | $192,678 | $449,582 |
| 2018 | $7,896 | $629,670 | $188,901 | $440,769 |
| 2017 | $7,698 | $617,327 | $185,198 | $432,129 |
| 2016 | $7,564 | $605,225 | $181,567 | $423,658 |
| 2015 | $7,461 | $596,137 | $178,841 | $417,296 |
| 2014 | $7,330 | $584,463 | $175,339 | $409,124 |
Source: Public Records
Map
Nearby Homes
- 3371 Baywood Terrace Unit 214
- 3751 Ruskin Place
- 3663 Oakwood Terrace Unit 211
- 3530 Oakwood Terrace Unit 102
- 3155 Mackenzie Place
- 3443 Pepperwood Terrace Unit 301
- 3507 Buttonwood Terrace Unit 203
- Plan 1725 at Veranda
- Plan 1670 at Veranda
- Plan 1657 at Veranda
- Plan 1629 at Veranda
- Plan 1455 at Veranda
- Plan 1394 at Veranda
- Plan 1378 at Veranda
- Plan 1165 at Veranda
- 37637 Canterbury St
- 4412 Elaiso Common
- 2579 Bishop Ave
- 4543 Bartolo Terrace
- 37001 Contra Costa Ave
- 3366 Surry Place
- 3410 Surry Place
- 3437 Atwater Ct
- 3425 Atwater Ct
- 3344 Surry Place
- 3436 Surry Place
- 3441 Atwater Ct
- 3453 Atwater Ct
- 3393 Surry Place
- 3381 Surry Place
- 3413 Atwater Ct
- 3322 Surry Place
- 3409 Surry Place
- 3468 Surry Place
- 3369 Surry Place
- 3433 Surry Place
- 3467 Atwater Ct
- 3357 Surry Place
- 3401 Atwater Ct
- 3300 Surry Place