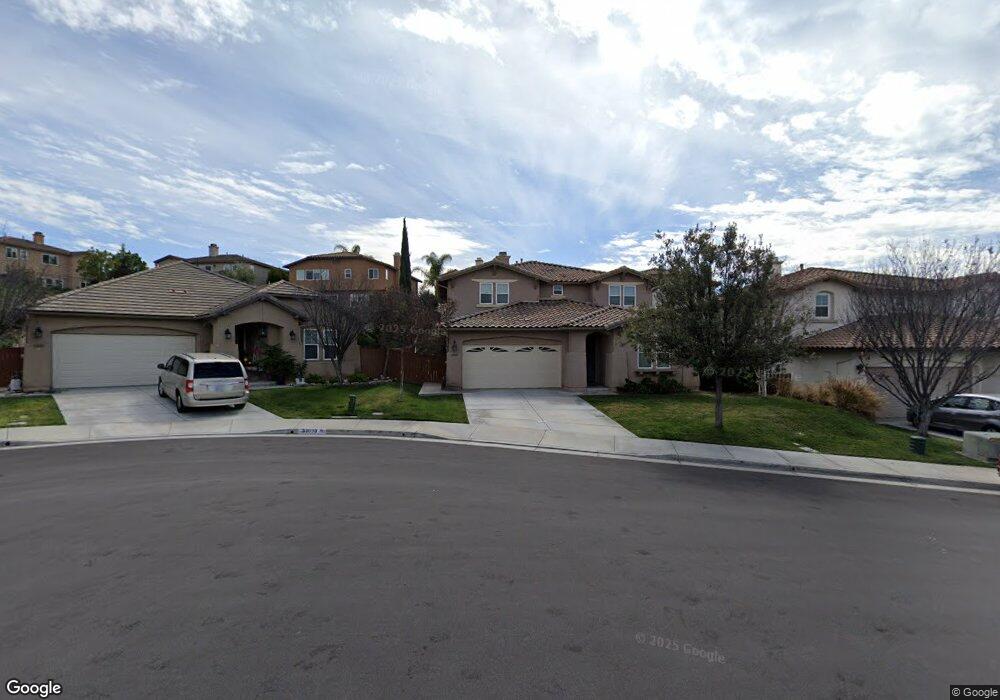
33883 Madrigal Ct Temecula, CA 92592
Morgan Hill NeighborhoodEstimated Value: $735,000 - $886,000
5
Beds
4
Baths
2,726
Sq Ft
$299/Sq Ft
Est. Value
About This Home
This home is located at 33883 Madrigal Ct, Temecula, CA 92592 and is currently estimated at $814,594, approximately $298 per square foot. 33883 Madrigal Ct is a home located in Riverside County with nearby schools including Tony Tobin Elementary School, Vail Ranch Middle School, and Great Oak High School.
Ownership History
Date
Name
Owned For
Owner Type
Purchase Details
Closed on
Aug 9, 2024
Sold by
Lee Botao and Yang Bi Ke
Bought by
Lee-Yang Family Trust and Lee
Current Estimated Value
Purchase Details
Closed on
Feb 3, 2011
Sold by
Yang Bi Ke
Bought by
Lee Botao and Yang Bi Ke
Purchase Details
Closed on
Dec 15, 2010
Sold by
Lee Botao
Bought by
Yang Bi Ke
Purchase Details
Closed on
Sep 13, 2010
Sold by
Ramos Antonio G and Ramos Marietta O
Bought by
Aurora Loan Services Llc
Purchase Details
Closed on
Sep 12, 2005
Sold by
Mcmillin Artessa Llc
Bought by
Ramos Antonio G and Ramos Marietta O
Home Financials for this Owner
Home Financials are based on the most recent Mortgage that was taken out on this home.
Original Mortgage
$399,999
Interest Rate
1%
Mortgage Type
Fannie Mae Freddie Mac
Create a Home Valuation Report for This Property
The Home Valuation Report is an in-depth analysis detailing your home's value as well as a comparison with similar homes in the area
Home Values in the Area
Average Home Value in this Area
Purchase History
| Date | Buyer | Sale Price | Title Company |
|---|---|---|---|
| Lee-Yang Family Trust | -- | None Listed On Document | |
| Lee Botao | -- | None Available | |
| Yang Bi Ke | -- | First American Title Company | |
| Yang Bi Ke | $260,000 | First American Title Company | |
| Aurora Loan Services Llc | $292,000 | None Available | |
| Ramos Antonio G | $535,500 | Fidelity National Title |
Source: Public Records
Mortgage History
| Date | Status | Borrower | Loan Amount |
|---|---|---|---|
| Previous Owner | Ramos Antonio G | $399,999 |
Source: Public Records
Tax History
| Year | Tax Paid | Tax Assessment Tax Assessment Total Assessment is a certain percentage of the fair market value that is determined by local assessors to be the total taxable value of land and additions on the property. | Land | Improvement |
|---|---|---|---|---|
| 2025 | $6,733 | $404,837 | $102,485 | $302,352 |
| 2023 | $6,733 | $389,118 | $98,506 | $290,612 |
| 2022 | $6,585 | $381,489 | $96,575 | $284,914 |
| 2021 | $6,486 | $374,010 | $94,682 | $279,328 |
| 2020 | $6,401 | $370,176 | $93,712 | $276,464 |
| 2019 | $6,334 | $362,919 | $91,875 | $271,044 |
| 2018 | $6,237 | $355,804 | $90,075 | $265,729 |
| 2017 | $6,133 | $348,828 | $88,309 | $260,519 |
| 2016 | $6,072 | $341,989 | $86,578 | $255,411 |
| 2015 | $6,391 | $336,854 | $85,279 | $251,575 |
| 2014 | $6,242 | $330,257 | $83,609 | $246,648 |
Source: Public Records
Map
Nearby Homes
- 33884 Pegase Ct
- 44840 Tudal St
- 45000 Vine Cliff St
- 44684 Mumm St
- 45055 Rutherford St
- 33919 Galleron St
- 33845 Sattui St
- 44797 Corte Sanchez
- 44928 Frogs Leap St
- 33578 Rosewood Cir
- 33751 Abbey Rd
- 44607 Crestwood Cir
- 33710 Sattui St
- 34116 Galleron St
- 34271 San Simeon St
- 45118 Riverstone Ct
- 45133 Fieldbrook Ct
- 44724 Calle Banuelos
- 33360 Barrington Dr
- 44364 Kingston Dr
- 33873 Madrigal Ct
- 33872 Flora Springs St
- 33863 Madrigal Ct
- 33862 Flora Springs St
- 33882 Flora Springs St
- 33852 Flora Springs St
- 33903 Madrigal Ct
- 33908 Madrigal Ct
- 33853 Madrigal Ct
- 33892 Flora Springs St
- 33878 Madrigal Ct
- 33868 Madrigal Ct
- 33842 Flora Springs St
- 33843 Madrigal Ct
- 44835 Rutherford St
- 33898 Madrigal Ct
- 44845 Rutherford St
- 44825 Rutherford St
- 33848 Madrigal Ct
- 44815 Rutherford St
Your Personal Tour Guide
Ask me questions while you tour the home.