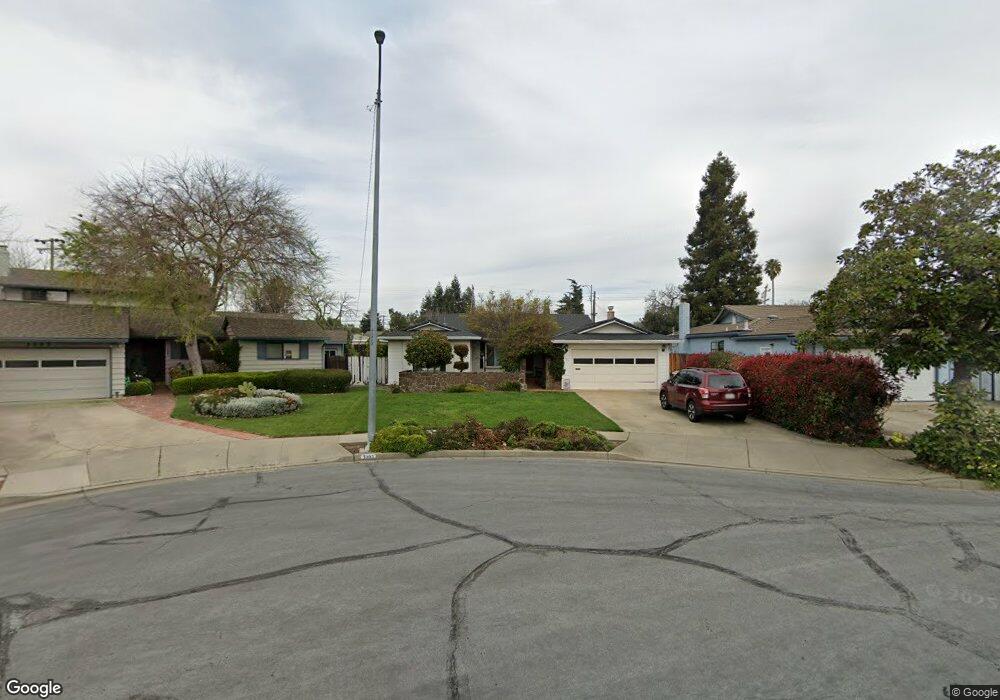
3389 Sutton Loop Fremont, CA 94536
Centerville District NeighborhoodEstimated Value: $1,160,000 - $1,732,000
3
Beds
2
Baths
1,680
Sq Ft
$890/Sq Ft
Est. Value
About This Home
This home is located at 3389 Sutton Loop, Fremont, CA 94536 and is currently estimated at $1,494,765, approximately $889 per square foot. 3389 Sutton Loop is a home located in Alameda County with nearby schools including Parkmont Elementary School, Centerville Junior High School, and Washington High School.
Ownership History
Date
Name
Owned For
Owner Type
Purchase Details
Closed on
Dec 9, 2016
Sold by
Narayanan Thiru and Narayanan Algu Lakshmi
Bought by
Narayanan Thiru and Narayanan Alagu Lakshmi
Current Estimated Value
Purchase Details
Closed on
May 4, 2012
Sold by
Narayanan Thiru and Narayanan Alagu Lakshmi
Bought by
Narayanan Thiru and Narayanan Alagu Lakshmi
Home Financials for this Owner
Home Financials are based on the most recent Mortgage that was taken out on this home.
Original Mortgage
$482,000
Outstanding Balance
$334,579
Interest Rate
3.94%
Mortgage Type
New Conventional
Estimated Equity
$1,160,186
Purchase Details
Closed on
Oct 14, 2009
Sold by
Tavares Richard and Tavares Jeannie
Bought by
Narayanan Thiru and Palaniappan Alagu Lakshmi
Home Financials for this Owner
Home Financials are based on the most recent Mortgage that was taken out on this home.
Original Mortgage
$512,000
Interest Rate
5.05%
Mortgage Type
New Conventional
Purchase Details
Closed on
Aug 31, 2004
Sold by
Shockley John and Estate Of Geraldine Peggy Shoc
Bought by
Tavares Richard and Tavares Jeannie
Home Financials for this Owner
Home Financials are based on the most recent Mortgage that was taken out on this home.
Original Mortgage
$448,000
Interest Rate
5.25%
Mortgage Type
Purchase Money Mortgage
Purchase Details
Closed on
Mar 17, 1994
Sold by
Great Western Bank
Bought by
Emc Mtg Corp
Home Financials for this Owner
Home Financials are based on the most recent Mortgage that was taken out on this home.
Original Mortgage
$150,000
Interest Rate
7%
Purchase Details
Closed on
Mar 10, 1994
Sold by
Emc Mtg Corp
Bought by
Shockley Geri Peggy
Home Financials for this Owner
Home Financials are based on the most recent Mortgage that was taken out on this home.
Original Mortgage
$150,000
Interest Rate
7%
Create a Home Valuation Report for This Property
The Home Valuation Report is an in-depth analysis detailing your home's value as well as a comparison with similar homes in the area
Home Values in the Area
Average Home Value in this Area
Purchase History
| Date | Buyer | Sale Price | Title Company |
|---|---|---|---|
| Narayanan Thiru | -- | None Available | |
| Narayanan Thiru | -- | First American Title Company | |
| Narayanan Thiru | $640,000 | Old Republic Title Company | |
| Tavares Richard | $560,000 | Fidelity National Title Co | |
| Emc Mtg Corp | $153,500 | Fidelity National Title | |
| Shockley Geri Peggy | $226,000 | Fidelity National Title Ins |
Source: Public Records
Mortgage History
| Date | Status | Borrower | Loan Amount |
|---|---|---|---|
| Open | Narayanan Thiru | $482,000 | |
| Closed | Narayanan Thiru | $512,000 | |
| Previous Owner | Tavares Richard | $448,000 | |
| Previous Owner | Shockley Geri Peggy | $150,000 | |
| Closed | Tavares Richard | $84,000 |
Source: Public Records
Tax History
| Year | Tax Paid | Tax Assessment Tax Assessment Total Assessment is a certain percentage of the fair market value that is determined by local assessors to be the total taxable value of land and additions on the property. | Land | Improvement |
|---|---|---|---|---|
| 2025 | $9,916 | $819,067 | $247,820 | $578,247 |
| 2024 | $9,916 | $802,874 | $242,962 | $566,912 |
| 2023 | $9,649 | $793,996 | $238,199 | $555,797 |
| 2022 | $9,523 | $771,431 | $233,529 | $544,902 |
| 2021 | $9,289 | $756,174 | $228,952 | $534,222 |
| 2020 | $9,311 | $755,353 | $226,606 | $528,747 |
| 2019 | $9,205 | $740,543 | $222,163 | $518,380 |
| 2018 | $9,024 | $726,028 | $217,808 | $508,220 |
| 2017 | $8,798 | $711,794 | $213,538 | $498,256 |
| 2016 | $8,647 | $697,842 | $209,352 | $488,490 |
| 2015 | $8,532 | $687,365 | $206,209 | $481,156 |
| 2014 | $8,384 | $673,907 | $202,172 | $471,735 |
Source: Public Records
Map
Nearby Homes
- 3393 Sutton Loop
- 3046 Greenwood Dr
- 3554 Shadowbrook Terrace
- 3623 Sutton Loop
- 37470 Parish Cir Unit 19C
- 3232 Red Cedar Terrace Unit LU15
- 3230 Red Cedar Terrace
- 37856 Bright Common
- 37311 Aspenwood Common Unit 203
- 3550 Buttonwood Terrace Unit 111
- 3685 Nutwood Terrace Unit 313
- 3665 Oxford Common
- 3041 Christine Ct
- 37445 Currant Terrace
- 37429 Fremont Blvd
- 37434 Hazel Terrace
- 3810 Burton Common
- 3833 Burton Common
- 3312 Howard Common
- 37168 Meadowbrook Common Unit 304
- 3381 Sutton Loop
- 3399 Sutton Loop
- 3366 Peralta Blvd
- 3403 Sutton Loop
- 3398 Sutton Loop
- 37504 Zephyr Terrace
- 3516 Peralta Blvd
- 3365 Sutton Loop
- 3386 Sutton Loop
- 37505 Zephyr Terrace
- 3467 Peralta Blvd
- 3417 Sutton Loop
- 3536 Peralta Blvd
- 3411 Peralta Blvd
- 3439 Peralta Blvd
- 3381 Peralta Blvd
- 3495 Peralta Blvd
- 3365 Peralta Blvd
- 3374 Sutton Loop
- 3357 Sutton Loop
Your Personal Tour Guide
Ask me questions while you tour the home.