M
Seller's Agent in 2025
Michael Swaim
Swaim Appraisal
(515) 577-3361
1 in this area
15 Total Sales

Estimated Value: $668,000 - $689,000
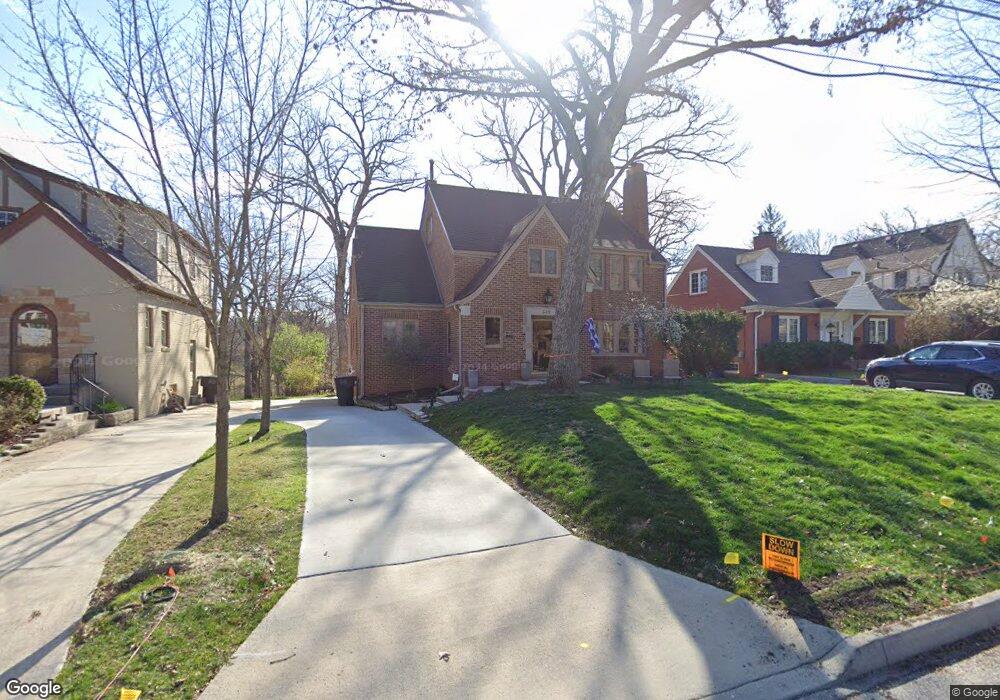
This home is located at 339 49th St, Des Moines, IA 50312 since 26 May 2025 and is currently estimated at $678,555, approximately $253 per square foot. This property was built in 1929. 339 49th St is a home located in Polk County with nearby schools including Hanawalt Elementary School, Merrill Middle School, and Roosevelt High School.
| Date | Buyer | Sale Price | Title Company |
|---|---|---|---|
| Cutler Scott | -- | None Listed On Document | |
| Cutler Scott | $687,000 | None Listed On Document | |
| Patricia L Drake Revocable Trust | -- | -- | |
| Drake Joel | $425,000 | None Available |
| Date | Status | Borrower | Loan Amount |
|---|---|---|---|
| Open | Cutler Scott | $486,867 | |
| Previous Owner | Drake Joel | $390,838 |
| Date | Event | Price | List to Sale | Price per Sq Ft |
|---|---|---|---|---|
| 12/17/2025 12/17/25 | Sold | $686,867 | -2.6% | $256 / Sq Ft |
| 06/16/2025 06/16/25 | Pending | -- | -- | -- |
| 05/26/2025 05/26/25 | For Sale | $705,000 | -- | $263 / Sq Ft |
| Year | Tax Paid | Tax Assessment Tax Assessment Total Assessment is a certain percentage of the fair market value that is determined by local assessors to be the total taxable value of land and additions on the property. | Land | Improvement |
|---|---|---|---|---|
| 2025 | $11,242 | $666,100 | $79,300 | $586,800 |
| 2024 | $11,242 | $597,300 | $70,100 | $527,200 |
| 2023 | $11,492 | $581,900 | $70,100 | $511,800 |
| 2022 | $11,402 | $496,500 | $62,200 | $434,300 |
| 2021 | $11,210 | $496,500 | $62,200 | $434,300 |
| 2020 | $11,640 | $457,800 | $57,100 | $400,700 |
| 2019 | $10,828 | $457,800 | $57,100 | $400,700 |
| 2018 | $10,712 | $411,400 | $50,300 | $361,100 |
| 2017 | $10,032 | $411,400 | $50,300 | $361,100 |
| 2016 | $9,998 | $379,400 | $45,700 | $333,700 |
| 2015 | $9,998 | $379,400 | $45,700 | $333,700 |
| 2014 | $6,590 | $266,300 | $41,900 | $224,400 |
M
Seller's Agent in 2025
Michael Swaim
Swaim Appraisal
(515) 577-3361
1 in this area
15 Total Sales

Buyer's Agent in 2025
Sara Gaskell
Iowa Realty Mills Crossing
(515) 350-4799
7 in this area
87 Total Sales
Source: Des Moines Area Association of REALTORS®
MLS Number: 720393
APN: 090-00576000000
Disclaimer: Certain information contained herein is derived from information provided by parties other than Homes.com. All information provided is deemed reliable, but is not guaranteed to be accurate and should be independently verified.
![]() IDX information is provided exclusively for personal, non-commercial use, and may not be used for any purpose other than to identify prospective properties consumers may be interested in purchasing. Information is deemed reliable but not guaranteed.
IDX information is provided exclusively for personal, non-commercial use, and may not be used for any purpose other than to identify prospective properties consumers may be interested in purchasing. Information is deemed reliable but not guaranteed.
Ask me questions while you tour the home.