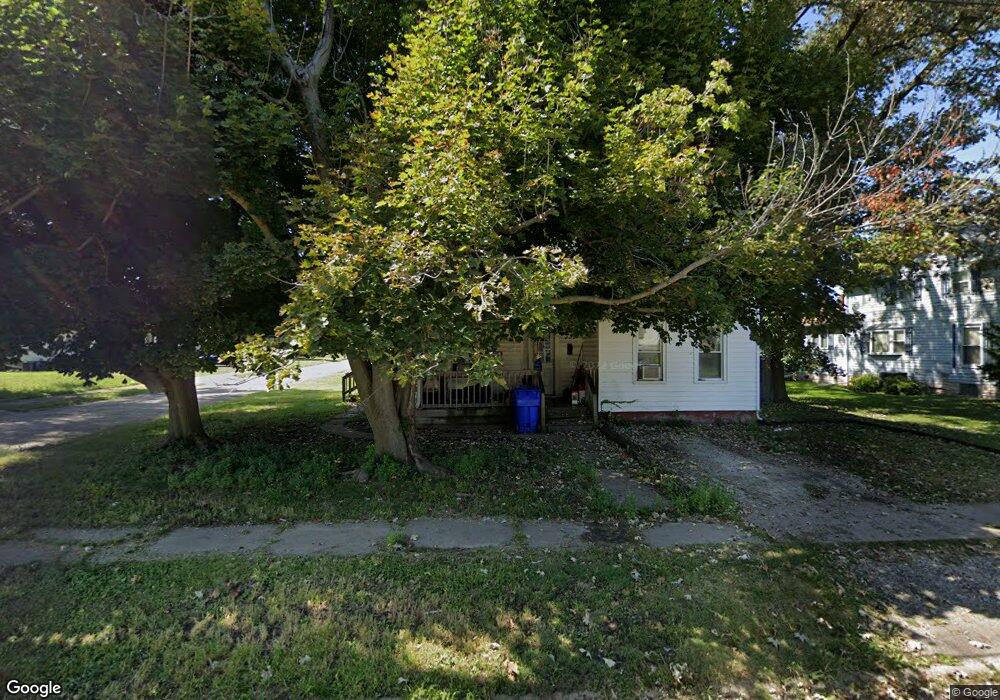
339 5th Ave Kewanee, IL 61443
Estimated Value: $41,000 - $55,000
3
Beds
--
Bath
876
Sq Ft
$55/Sq Ft
Est. Value
About This Home
This home is located at 339 5th Ave, Kewanee, IL 61443 and is currently estimated at $48,336, approximately $55 per square foot. 339 5th Ave is a home located in Henry County with nearby schools including Kewanee High School and Visitation Catholic School.
Ownership History
Date
Name
Owned For
Owner Type
Purchase Details
Closed on
Aug 23, 2014
Sold by
First Federal Savings & Loan Association
Bought by
Vanstaden Sandra
Current Estimated Value
Home Financials for this Owner
Home Financials are based on the most recent Mortgage that was taken out on this home.
Original Mortgage
$27,000
Outstanding Balance
$8,329
Interest Rate
3.17%
Mortgage Type
New Conventional
Estimated Equity
$40,007
Purchase Details
Closed on
Jun 14, 2011
Sold by
Longeville Blake A
Bought by
First Federal Savings & Loan Association
Purchase Details
Closed on
Apr 27, 2009
Sold by
Verschage Rodney A and Verschage Megan N
Bought by
Longeville Blake A
Purchase Details
Closed on
Oct 21, 2008
Sold by
Zumber Donald A
Bought by
Longeville Blake A
Home Financials for this Owner
Home Financials are based on the most recent Mortgage that was taken out on this home.
Original Mortgage
$34,400
Interest Rate
5.53%
Mortgage Type
New Conventional
Create a Home Valuation Report for This Property
The Home Valuation Report is an in-depth analysis detailing your home's value as well as a comparison with similar homes in the area
Home Values in the Area
Average Home Value in this Area
Purchase History
| Date | Buyer | Sale Price | Title Company |
|---|---|---|---|
| Vanstaden Sandra | $27,000 | None Available | |
| First Federal Savings & Loan Association | -- | None Available | |
| Longeville Blake A | -- | None Available | |
| Longeville Blake A | $18,500 | None Available |
Source: Public Records
Mortgage History
| Date | Status | Borrower | Loan Amount |
|---|---|---|---|
| Open | Vanstaden Sandra | $27,000 | |
| Previous Owner | Longeville Blake A | $34,400 |
Source: Public Records
Tax History
| Year | Tax Paid | Tax Assessment Tax Assessment Total Assessment is a certain percentage of the fair market value that is determined by local assessors to be the total taxable value of land and additions on the property. | Land | Improvement |
|---|---|---|---|---|
| 2024 | $510 | $10,724 | $1,237 | $9,487 |
| 2023 | $409 | $9,491 | $1,095 | $8,396 |
| 2022 | $416 | $8,636 | $996 | $7,640 |
| 2021 | $429 | $7,996 | $922 | $7,074 |
| 2020 | $431 | $7,820 | $902 | $6,918 |
| 2019 | $420 | $8,159 | $941 | $7,218 |
| 2018 | $424 | $8,359 | $964 | $7,395 |
| 2017 | $423 | $8,252 | $952 | $7,300 |
| 2016 | $422 | $8,336 | $962 | $7,374 |
| 2015 | $991 | $8,197 | $946 | $7,251 |
| 2013 | $991 | $8,405 | $970 | $7,435 |
Source: Public Records
Map
Nearby Homes
- 512 Commercial St
- 1205 Roseview Ave
- 110 N Park St
- 716 W 3rd St
- 702 Elliott St Unit 1
- 122 Beach St S
- 215 W Prospect St
- 422 Ross St
- 136 W Mill St
- 236 W Church St
- 714 S Main St
- 732 S Main St
- 124 E Mill St
- 337 Whitney Ave
- 716 Morton Ave
- 328 E Prospect St
- 416 Payson St
- 0 N Main St Unit E 2nd
- 436 Hollis St
- 630 N Burr St
Your Personal Tour Guide
Ask me questions while you tour the home.