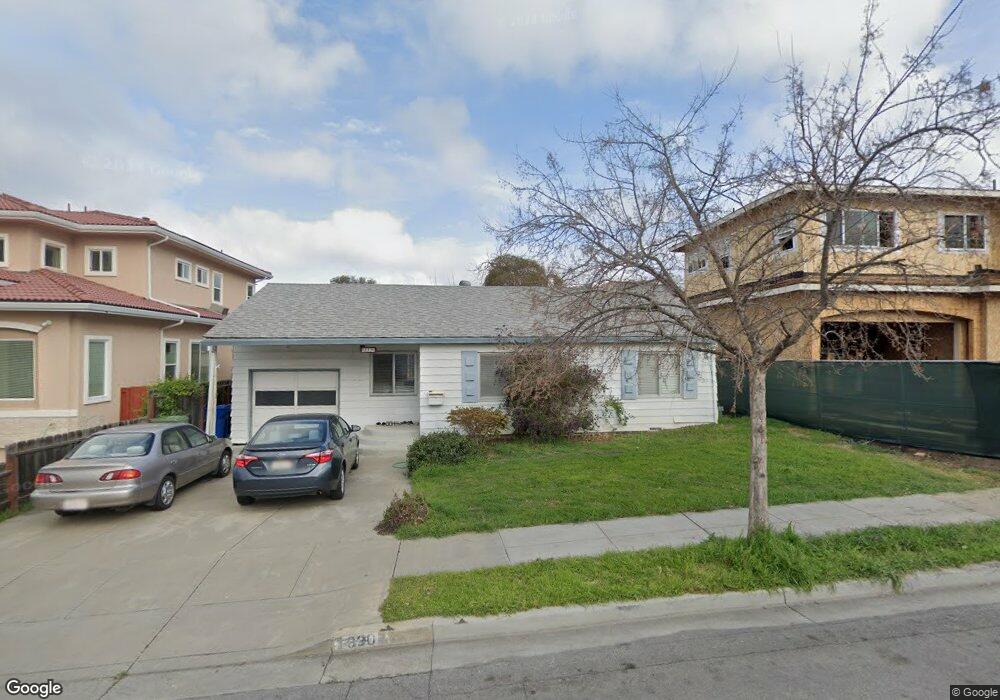
339 Anza St Fremont, CA 94539
Mission San Jose NeighborhoodEstimated Value: $1,412,000 - $1,811,000
3
Beds
1
Bath
951
Sq Ft
$1,716/Sq Ft
Est. Value
About This Home
This home is located at 339 Anza St, Fremont, CA 94539 and is currently estimated at $1,631,656, approximately $1,715 per square foot. 339 Anza St is a home located in Alameda County with nearby schools including Mission San Jose Elementary School, William Hopkins Junior High School, and Mission San Jose High School.
Ownership History
Date
Name
Owned For
Owner Type
Purchase Details
Closed on
Aug 11, 2019
Sold by
Pal Minfan and Chen Jennifer Kuei Yang
Bought by
Pal Minfan and Chen Jennifer
Current Estimated Value
Purchase Details
Closed on
Mar 27, 2012
Sold by
Lee Sal Kong Frank and Cheng Grace K H
Bought by
Pai Minfan and Chen Jennifer Kuei Yang
Purchase Details
Closed on
Apr 8, 2005
Sold by
Zolck Danita Rose Carrillo and Siewell Joel
Bought by
Lee Sai Kong Frank and Cheng Grace K H
Home Financials for this Owner
Home Financials are based on the most recent Mortgage that was taken out on this home.
Original Mortgage
$552,000
Interest Rate
5.62%
Mortgage Type
Purchase Money Mortgage
Purchase Details
Closed on
Oct 30, 2003
Sold by
Carrillo Zolck Danita Rose
Bought by
Zolck Danita Rose Carrillo and Siewell Joel
Home Financials for this Owner
Home Financials are based on the most recent Mortgage that was taken out on this home.
Original Mortgage
$376,000
Interest Rate
5.75%
Mortgage Type
Purchase Money Mortgage
Purchase Details
Closed on
Dec 11, 2001
Sold by
Zolck John A and Carrillo Zolck Danita Rose
Bought by
Zolck John A and Carrillo Zolck Danita Rose
Home Financials for this Owner
Home Financials are based on the most recent Mortgage that was taken out on this home.
Original Mortgage
$345,000
Interest Rate
6.37%
Purchase Details
Closed on
Nov 20, 1998
Sold by
Dillon Valerie J
Bought by
Zolck John A and Carrillo Zolck Danita Rose
Home Financials for this Owner
Home Financials are based on the most recent Mortgage that was taken out on this home.
Original Mortgage
$216,000
Interest Rate
6.84%
Mortgage Type
Balloon
Purchase Details
Closed on
Jul 8, 1998
Sold by
Mattingly Valerie J and Mattingly Valerie J
Bought by
Dillon Valerie J
Home Financials for this Owner
Home Financials are based on the most recent Mortgage that was taken out on this home.
Original Mortgage
$176,600
Interest Rate
7%
Purchase Details
Closed on
May 8, 1998
Sold by
Dillon Valeri
Bought by
Dillon Robert E
Purchase Details
Closed on
Sep 27, 1993
Sold by
Mattingly Mark and Mattingly Valeri Jean
Bought by
Mattingly Valeri Jean
Home Financials for this Owner
Home Financials are based on the most recent Mortgage that was taken out on this home.
Original Mortgage
$125,000
Interest Rate
6.98%
Create a Home Valuation Report for This Property
The Home Valuation Report is an in-depth analysis detailing your home's value as well as a comparison with similar homes in the area
Home Values in the Area
Average Home Value in this Area
Purchase History
| Date | Buyer | Sale Price | Title Company |
|---|---|---|---|
| Pal Minfan | -- | None Available | |
| Pai Minfan | $667,000 | Chicago Title Company | |
| Lee Sai Kong Frank | $735,000 | Fidelity National Title Co | |
| Zolck Danita Rose Carrillo | $219,000 | Placer Title Company | |
| Zolck John A | -- | Financial Title Company | |
| Zolck John A | $270,000 | Fidelity National Title Co | |
| Dillon Valerie J | -- | Chicago Title Co | |
| Dillon Robert E | -- | Fidelity National Title Co | |
| Mattingly Valeri Jean | $62,500 | Fidelity National Title Co |
Source: Public Records
Mortgage History
| Date | Status | Borrower | Loan Amount |
|---|---|---|---|
| Previous Owner | Lee Sai Kong Frank | $552,000 | |
| Previous Owner | Zolck Danita Rose Carrillo | $376,000 | |
| Previous Owner | Zolck John A | $345,000 | |
| Previous Owner | Zolck John A | $216,000 | |
| Previous Owner | Dillon Valerie J | $176,600 | |
| Previous Owner | Mattingly Valeri Jean | $125,000 | |
| Closed | Dillon Valerie J | $70,000 | |
| Closed | Zolck John A | $54,000 | |
| Closed | Zolck Danita Rose Carrillo | $62,000 |
Source: Public Records
Tax History Compared to Growth
Tax History
| Year | Tax Paid | Tax Assessment Tax Assessment Total Assessment is a certain percentage of the fair market value that is determined by local assessors to be the total taxable value of land and additions on the property. | Land | Improvement |
|---|---|---|---|---|
| 2025 | $10,130 | $837,745 | $502,396 | $335,349 |
| 2024 | $10,130 | $821,323 | $492,548 | $328,775 |
| 2023 | $9,860 | $805,222 | $482,892 | $322,330 |
| 2022 | $9,733 | $789,434 | $473,424 | $316,010 |
| 2021 | $9,495 | $773,960 | $464,144 | $309,816 |
| 2020 | $9,522 | $766,029 | $459,388 | $306,641 |
| 2019 | $9,414 | $751,015 | $450,384 | $300,631 |
| 2018 | $9,232 | $736,294 | $441,556 | $294,738 |
| 2017 | $9,002 | $721,860 | $432,900 | $288,960 |
| 2016 | $8,850 | $707,707 | $424,412 | $283,295 |
| 2015 | $8,733 | $697,081 | $418,040 | $279,041 |
| 2014 | $8,584 | $683,428 | $409,852 | $273,576 |
Source: Public Records
Map
Nearby Homes
- 341 Dana St
- 43547 Ellsworth St
- 483 Becado Place
- 43382 Bryant St
- 43150 Starr St
- 905 Glenhill Dr
- 646 Bella Vista Ct
- 335 Via Rosario
- 42955 Corte Verde
- 42965 Corte Verde
- 138 Telles Ln
- 124 Linmore Dr
- 43555 Puesta Del Sol
- 42099 Vinha Way
- 379 Felipe Common
- 2164 Ocaso Camino
- 44423 View Point Cir
- 42329 Troyer Ave
- 2450 Euclid Place
- 2225 Valorie St