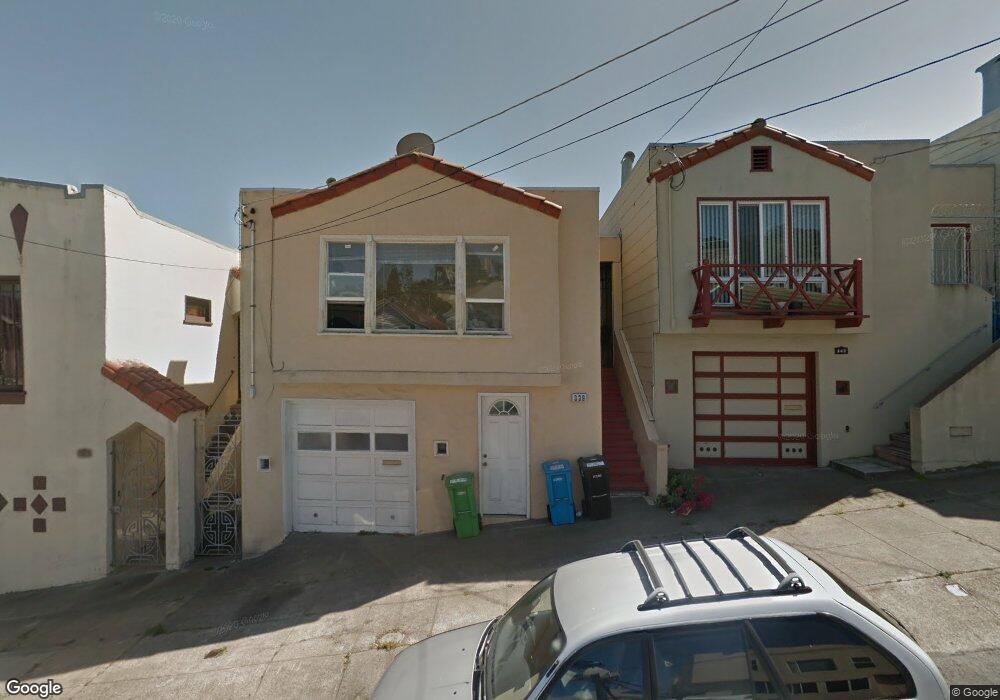
339 Arleta Ave San Francisco, CA 94134
Visitacion Valley NeighborhoodEstimated Value: $978,000 - $1,068,410
3
Beds
2
Baths
1,713
Sq Ft
$593/Sq Ft
Est. Value
About This Home
This home is located at 339 Arleta Ave, San Francisco, CA 94134 and is currently estimated at $1,015,353, approximately $592 per square foot. 339 Arleta Ave is a home located in San Francisco County with nearby schools including El Dorado Elementary School, Visitacion Valley Middle School, and KIPP Bayview Academy.
Ownership History
Date
Name
Owned For
Owner Type
Purchase Details
Closed on
Sep 28, 2005
Sold by
Lee June
Bought by
Wong Ken
Current Estimated Value
Home Financials for this Owner
Home Financials are based on the most recent Mortgage that was taken out on this home.
Original Mortgage
$359,600
Outstanding Balance
$184,649
Interest Rate
5.12%
Mortgage Type
Purchase Money Mortgage
Estimated Equity
$830,704
Purchase Details
Closed on
Sep 23, 2005
Sold by
Wong Ken
Bought by
Wong Ken
Home Financials for this Owner
Home Financials are based on the most recent Mortgage that was taken out on this home.
Original Mortgage
$359,600
Outstanding Balance
$184,649
Interest Rate
5.12%
Mortgage Type
Purchase Money Mortgage
Estimated Equity
$830,704
Purchase Details
Closed on
Nov 19, 2001
Sold by
Wong Ken and Wang Jian Ming Ken
Bought by
Wong Ken
Home Financials for this Owner
Home Financials are based on the most recent Mortgage that was taken out on this home.
Original Mortgage
$230,000
Interest Rate
6.06%
Purchase Details
Closed on
Aug 4, 1998
Sold by
Kuen Poon Wang and Ching Wai
Bought by
Wang Jian Ming Ken
Home Financials for this Owner
Home Financials are based on the most recent Mortgage that was taken out on this home.
Original Mortgage
$144,000
Interest Rate
6.95%
Create a Home Valuation Report for This Property
The Home Valuation Report is an in-depth analysis detailing your home's value as well as a comparison with similar homes in the area
Home Values in the Area
Average Home Value in this Area
Purchase History
| Date | Buyer | Sale Price | Title Company |
|---|---|---|---|
| Wong Ken | -- | First American Title Company | |
| Wong Ken | -- | First American Title Company | |
| Wong Ken | -- | Chicago Title Co | |
| Wang Jian Ming Ken | $160,000 | Chicago Title Co |
Source: Public Records
Mortgage History
| Date | Status | Borrower | Loan Amount |
|---|---|---|---|
| Open | Wong Ken | $359,600 | |
| Closed | Wong Ken | $359,600 | |
| Closed | Wong Ken | $230,000 | |
| Closed | Wang Jian Ming Ken | $144,000 | |
| Closed | Wong Ken | $60,000 |
Source: Public Records
Tax History Compared to Growth
Tax History
| Year | Tax Paid | Tax Assessment Tax Assessment Total Assessment is a certain percentage of the fair market value that is determined by local assessors to be the total taxable value of land and additions on the property. | Land | Improvement |
|---|---|---|---|---|
| 2025 | $4,094 | $294,892 | $125,404 | $169,488 |
| 2024 | $4,094 | $289,112 | $122,946 | $166,166 |
| 2023 | $4,022 | $283,445 | $120,536 | $162,909 |
| 2022 | $3,928 | $277,889 | $118,173 | $159,716 |
| 2021 | $3,852 | $272,441 | $115,856 | $156,585 |
| 2020 | $3,888 | $269,650 | $114,669 | $154,981 |
| 2019 | $3,758 | $264,364 | $112,421 | $151,943 |
| 2018 | $3,631 | $259,182 | $110,217 | $148,965 |
| 2017 | $3,289 | $254,101 | $108,056 | $146,045 |
| 2016 | $3,207 | $249,121 | $105,938 | $143,183 |
| 2015 | $3,164 | $245,380 | $104,347 | $141,033 |
| 2014 | $3,081 | $240,574 | $102,303 | $138,271 |
Source: Public Records
Map
Nearby Homes
- 291 Raymond Ave
- 550 Leland Ave
- 137 Arleta Ave
- 451 Sawyer St
- 771 Delta St
- 73 Tioga Ave
- 1316 Bowdoin St
- 420 Harkness Ave
- 750 Mansell St
- 1162 Bowdoin St
- 1081 Goettingen St
- 248 Ordway St
- 3630 San Bruno Ave
- 0 Accacia St
- 819 Brussels St
- 68 Esquina Dr
- 38 Jennings Ct Unit 38
- 107 Dwight St
- 1383 Bacon St
- 311 Ottilia St
- 335 Arleta Ave
- 343 Arleta Ave
- 331 Arleta Ave
- 347 Arleta Ave
- 327 Arleta Ave
- 351 Arleta Ave
- 325 Arleta Ave
- 355 Arleta Ave
- 338 Raymond Ave
- 334 Raymond Ave
- 342 Raymond Ave
- 346 Raymond Ave
- 319 Arleta Ave
- 350 Raymond Ave
- 359 Arleta Ave
- 322 Raymond Ave
- 330 Raymond Ave
- 354 Raymond Ave
- 315 Arleta Ave
- 363 Arleta Ave