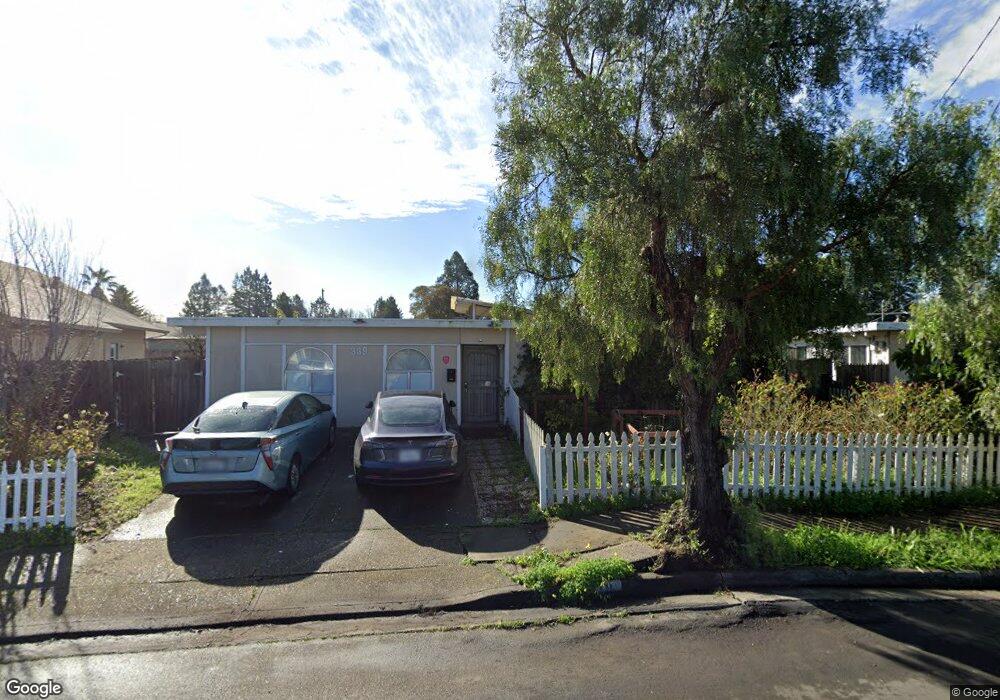
339 Bonnie Ave Rohnert Park, CA 94928
Estimated Value: $663,000 - $791,872
4
Beds
2
Baths
1,988
Sq Ft
$370/Sq Ft
Est. Value
About This Home
This home is located at 339 Bonnie Ave, Rohnert Park, CA 94928 and is currently estimated at $734,968, approximately $369 per square foot. 339 Bonnie Ave is a home located in Sonoma County with nearby schools including Rancho Cotate High School, Cross & Crown Lutheran School, and Bridghaven.
Ownership History
Date
Name
Owned For
Owner Type
Purchase Details
Closed on
Oct 29, 2012
Sold by
Hsu Chia Tai Charles
Bought by
Hong Ning and Zhou Yuan
Current Estimated Value
Purchase Details
Closed on
Jul 1, 2004
Sold by
Kennemer Washeba James B and Kennemer Washeba Glory G
Bought by
Hsu Chia Tai Charles and Hong Ning
Home Financials for this Owner
Home Financials are based on the most recent Mortgage that was taken out on this home.
Original Mortgage
$368,000
Interest Rate
6.12%
Mortgage Type
Purchase Money Mortgage
Purchase Details
Closed on
Jun 30, 2004
Sold by
Hong Yan Yi Jennie
Bought by
Hsu Chia Tai Charles
Home Financials for this Owner
Home Financials are based on the most recent Mortgage that was taken out on this home.
Original Mortgage
$368,000
Interest Rate
6.12%
Mortgage Type
Purchase Money Mortgage
Create a Home Valuation Report for This Property
The Home Valuation Report is an in-depth analysis detailing your home's value as well as a comparison with similar homes in the area
Home Values in the Area
Average Home Value in this Area
Purchase History
| Date | Buyer | Sale Price | Title Company |
|---|---|---|---|
| Hong Ning | -- | None Available | |
| Hsu Chia Tai Charles | $460,000 | First American Title Co | |
| Hsu Chia Tai Charles | -- | First American Title Co |
Source: Public Records
Mortgage History
| Date | Status | Borrower | Loan Amount |
|---|---|---|---|
| Previous Owner | Hsu Chia Tai Charles | $368,000 | |
| Closed | Hsu Chia Tai Charles | $69,000 |
Source: Public Records
Tax History Compared to Growth
Tax History
| Year | Tax Paid | Tax Assessment Tax Assessment Total Assessment is a certain percentage of the fair market value that is determined by local assessors to be the total taxable value of land and additions on the property. | Land | Improvement |
|---|---|---|---|---|
| 2025 | $5,767 | $512,070 | $178,002 | $334,068 |
| 2024 | $5,767 | $502,030 | $174,512 | $327,518 |
| 2023 | $5,767 | $492,188 | $171,091 | $321,097 |
| 2022 | $5,651 | $482,538 | $167,737 | $314,801 |
| 2021 | $5,603 | $473,078 | $164,449 | $308,629 |
| 2020 | $5,684 | $468,228 | $162,763 | $305,465 |
| 2019 | $5,609 | $459,048 | $159,572 | $299,476 |
| 2018 | $5,499 | $450,048 | $156,444 | $293,604 |
| 2017 | $5,405 | $441,225 | $153,377 | $287,848 |
| 2016 | $5,181 | $432,574 | $150,370 | $282,204 |
| 2015 | $5,053 | $426,078 | $148,112 | $277,966 |
| 2014 | $4,400 | $366,000 | $127,000 | $239,000 |
Source: Public Records
Map
Nearby Homes
- 359 Bonnie Ave
- 368 Bonnie Ct
- 8175 Arthur St
- 293 Lincoln Ave
- 7449 Adrian Dr
- 101 Pinewood Ct
- 8034 Adrian Dr
- 461 Lincoln Ave
- 219 College View Dr
- 8440 Lasalle Ave
- 11 Ramble Creek Dr
- 105 Nicholas Ct
- 218 W Cotati Ave
- 7530 Bernice Ave
- 8020 Beverly Dr
- 121 Forno Way
- 152 Valparaiso Ave
- 220 Mendelssohn Ct
- 746 Bernadette Ave
- 95 Jagla St