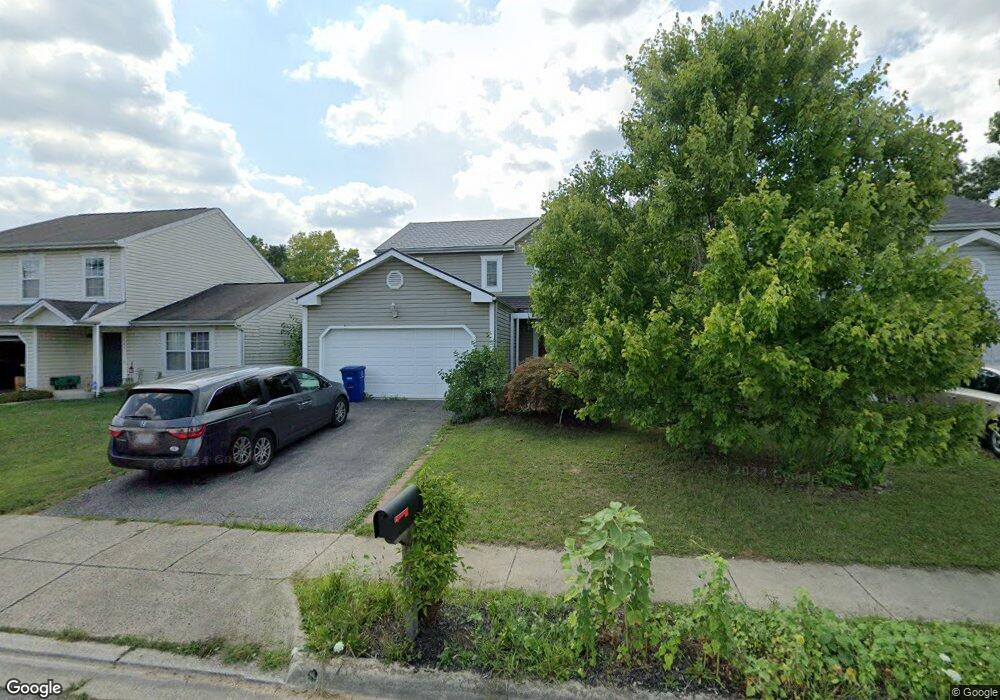
339 Charing Cross St Galloway, OH 43119
Westchester-Green Countrie NeighborhoodEstimated Value: $315,000 - $347,000
4
Beds
3
Baths
2,142
Sq Ft
$154/Sq Ft
Est. Value
About This Home
This home is located at 339 Charing Cross St, Galloway, OH 43119 and is currently estimated at $330,764, approximately $154 per square foot. 339 Charing Cross St is a home located in Franklin County with nearby schools including Darby Woods Elementary School, Galloway Ridge Intermediate School, and Norton Middle School.
Ownership History
Date
Name
Owned For
Owner Type
Purchase Details
Closed on
Apr 6, 2018
Sold by
Dettloff Alexander B C and Dettloff Jennifer J
Bought by
Bozzo Melinda and Bozzo Alexander
Current Estimated Value
Purchase Details
Closed on
Jul 11, 2007
Sold by
Dettloff Alexander B C and Dettloff Jennifer J
Bought by
Dettloff Alexander B C and Dettloff Jennifer J
Purchase Details
Closed on
Nov 12, 2004
Sold by
Hud
Bought by
Dettloff Alexander B C
Home Financials for this Owner
Home Financials are based on the most recent Mortgage that was taken out on this home.
Original Mortgage
$120,000
Outstanding Balance
$60,402
Interest Rate
5.91%
Mortgage Type
Purchase Money Mortgage
Estimated Equity
$270,362
Purchase Details
Closed on
Jul 27, 2004
Sold by
Schneider Robert J and Principal Residential Mortgage
Bought by
Hud
Purchase Details
Closed on
Sep 25, 1997
Sold by
Maronda Homes Inc
Bought by
Schneider Robert J
Purchase Details
Closed on
Sep 12, 1994
Sold by
R & T Land Ptns
Bought by
Italia Homes Inc
Home Financials for this Owner
Home Financials are based on the most recent Mortgage that was taken out on this home.
Original Mortgage
$90,000
Interest Rate
8.65%
Mortgage Type
New Conventional
Create a Home Valuation Report for This Property
The Home Valuation Report is an in-depth analysis detailing your home's value as well as a comparison with similar homes in the area
Home Values in the Area
Average Home Value in this Area
Purchase History
| Date | Buyer | Sale Price | Title Company |
|---|---|---|---|
| Bozzo Melinda | -- | None Available | |
| Dettloff Alexander B C | -- | All Ohio T | |
| Dettloff Alexander B C | $150,000 | Lakeside Ti | |
| Hud | $151,032 | -- | |
| Schneider Robert J | $129,900 | Chicago Title | |
| Italia Homes Inc | $120,000 | -- |
Source: Public Records
Mortgage History
| Date | Status | Borrower | Loan Amount |
|---|---|---|---|
| Open | Dettloff Alexander B C | $120,000 | |
| Previous Owner | Italia Homes Inc | $90,000 | |
| Closed | Dettloff Alexander B C | $15,000 |
Source: Public Records
Tax History Compared to Growth
Tax History
| Year | Tax Paid | Tax Assessment Tax Assessment Total Assessment is a certain percentage of the fair market value that is determined by local assessors to be the total taxable value of land and additions on the property. | Land | Improvement |
|---|---|---|---|---|
| 2024 | $3,852 | $105,640 | $24,960 | $80,680 |
| 2023 | $3,784 | $105,630 | $24,955 | $80,675 |
| 2022 | $3,017 | $61,810 | $6,580 | $55,230 |
| 2021 | $3,077 | $61,810 | $6,580 | $55,230 |
| 2020 | $3,060 | $61,810 | $6,580 | $55,230 |
| 2019 | $2,873 | $51,210 | $5,250 | $45,960 |
| 2018 | $2,850 | $51,210 | $5,250 | $45,960 |
| 2017 | $2,846 | $51,210 | $5,250 | $45,960 |
| 2016 | $2,840 | $46,940 | $6,790 | $40,150 |
| 2015 | $2,840 | $46,940 | $6,790 | $40,150 |
| 2014 | $2,843 | $46,940 | $6,790 | $40,150 |
| 2013 | $1,658 | $55,195 | $7,980 | $47,215 |
Source: Public Records
Map
Nearby Homes
- 429 Postle Blvd
- 477 Clairbrook Ave
- 417 Pamlico St Unit JK2
- 5728 Greendale Dr
- 452 Pamlico St Unit 9
- 491 Clairbrook Ave Unit 3
- 515 Clairbrook Ave
- 542 Clairbrook Ave Unit 11
- 5722 Silver Spurs Ln
- 5824 Hunting Hollow Ct Unit 5824-5826
- 40 Gladys Rd
- 110 Pasadena Ave
- 631 Dlyn St Unit 12
- 5715 Oyster Bay Way
- 5409 Longworth Dr
- 5006 Old Tree Ave
- 264 Woodlawn Ave
- 805 Pipers Ln
- 435 Redmond Rd
- 5504 Inglecrest Place
- 333 Charing Cross St
- 345 Charing Cross St
- 351 Charing Cross St
- 327 Charing Cross St
- 330 Eastcreek Dr
- 324 Eastcreek Dr
- 316 Creekside Plaza
- 319 Charing Cross St
- 359 Charing Cross St
- 316 Eastcreek Dr
- 5499 Avonhurst Ct
- 5537 High Arbor Dr
- 346 Charing Cross St
- 308 Eastcreek Dr
- 317 Charing Cross St
- 5517 High Arbor Dr
- 354 Charing Cross St
- 311 Charing Cross St
- 5491 Avonhurst Ct
- 5545 High Arbor Dr