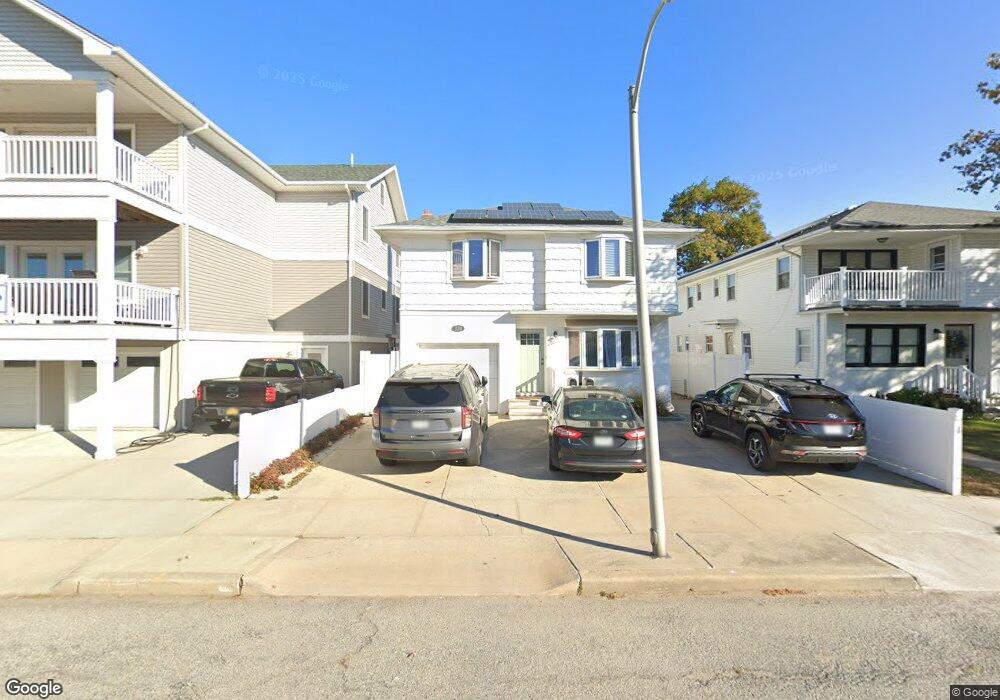
339 E Chester St Unit Lower Long Beach, NY 11561
Estimated Value: $883,343 - $1,054,000
3
Beds
1
Bath
1,500
Sq Ft
$646/Sq Ft
Est. Value
About This Home
This home is located at 339 E Chester St Unit Lower, Long Beach, NY 11561 and is currently estimated at $968,672, approximately $645 per square foot. 339 E Chester St Unit Lower is a home located in Nassau County with nearby schools including Lido Elementary School, East Elementary School, and Lindell Elementary School.
Ownership History
Date
Name
Owned For
Owner Type
Purchase Details
Closed on
Mar 26, 2020
Sold by
Zabrocki Nicholas
Bought by
Pual Bryan P and Pual Stefanie M
Current Estimated Value
Home Financials for this Owner
Home Financials are based on the most recent Mortgage that was taken out on this home.
Original Mortgage
$642,154
Outstanding Balance
$572,567
Interest Rate
3.75%
Mortgage Type
FHA
Estimated Equity
$396,105
Create a Home Valuation Report for This Property
The Home Valuation Report is an in-depth analysis detailing your home's value as well as a comparison with similar homes in the area
Home Values in the Area
Average Home Value in this Area
Purchase History
| Date | Buyer | Sale Price | Title Company |
|---|---|---|---|
| Pual Bryan P | $654,000 | First American Title |
Source: Public Records
Mortgage History
| Date | Status | Borrower | Loan Amount |
|---|---|---|---|
| Open | Pual Bryan P | $642,154 |
Source: Public Records
Tax History Compared to Growth
Tax History
| Year | Tax Paid | Tax Assessment Tax Assessment Total Assessment is a certain percentage of the fair market value that is determined by local assessors to be the total taxable value of land and additions on the property. | Land | Improvement |
|---|---|---|---|---|
| 2025 | $8,467 | $588 | $207 | $381 |
| 2024 | $1,111 | $584 | $206 | $378 |
| 2023 | $9,127 | $589 | $208 | $381 |
| 2022 | $9,127 | $598 | $211 | $387 |
| 2021 | $19,695 | $612 | $216 | $396 |
| 2020 | $16,205 | $1,281 | $725 | $556 |
| 2019 | $1,772 | $1,281 | $725 | $556 |
| 2018 | $1,647 | $1,281 | $0 | $0 |
| 2017 | $8,524 | $1,281 | $725 | $556 |
| 2016 | $1,581 | $1,281 | $725 | $556 |
| 2015 | $1,572 | $1,281 | $725 | $556 |
| 2014 | $1,572 | $1,281 | $725 | $556 |
| 2013 | $1,503 | $1,281 | $725 | $556 |
Source: Public Records
Map
Nearby Homes
- 360 E Hudson St
- 342 E Fulton St
- 344 E Fulton St
- 345 E Park Ave
- 340 E Pine St
- 347 E Pine St
- 228 E Market St
- 460 E Market St
- 213 E Market St
- 272 E Harrison St
- 709 Monroe Blvd
- 257 E Olive St
- 318 E Olive St
- 345 E Beech St
- 545 E Fulton St
- 570 E Chester St
- 208 Franklin Blvd
- 535 E Olive St
- 151 E Olive St
- 333 E Broadway Unit 3B
- 339 E Chester St
- 339 E Chester St Unit Upper
- 335 E Chester St
- 343 E Chester St
- 329 E Chester St
- 355 E Chester St
- 336 E Market St
- 325 E Chester St
- 350 E Market St
- 330 E Market St
- 323 E Chester St
- 352 E Market St
- 336 E Chester St
- 340 E Chester St
- 328 E Market St
- 359 E Chester St Unit 2
- 359 E Chester St
- 359 E Chester St
- 359 E Chester St Unit Rear
- 332 E Chester St