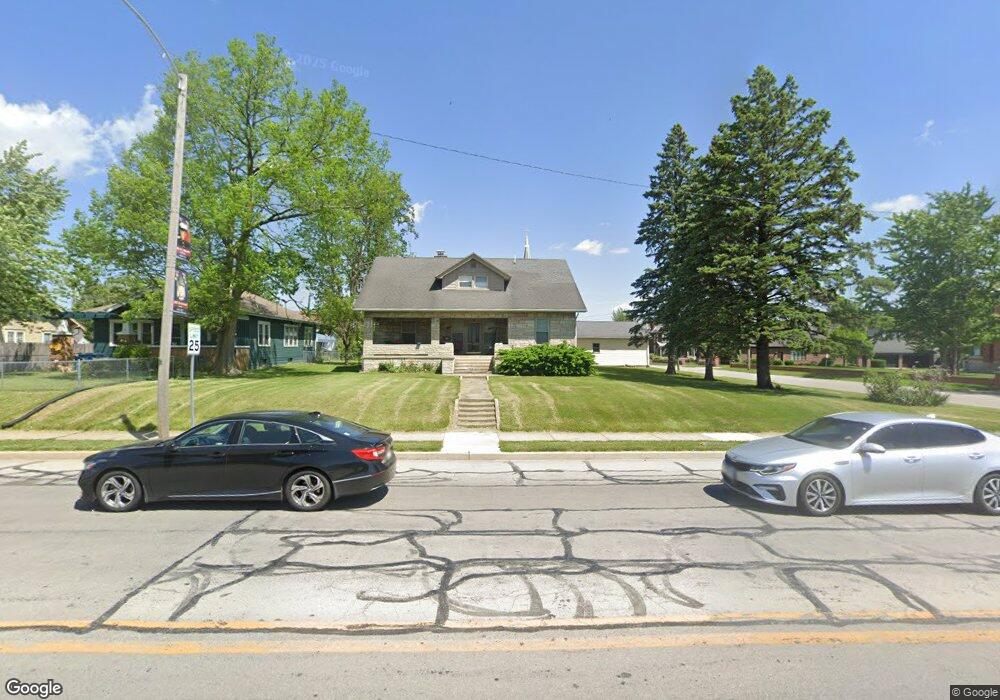
339 E Main St Gas City, IN 46933
Estimated Value: $162,000 - $218,000
4
Beds
2
Baths
2,075
Sq Ft
$91/Sq Ft
Est. Value
About This Home
This home is located at 339 E Main St, Gas City, IN 46933 and is currently estimated at $188,462, approximately $90 per square foot. 339 E Main St is a home located in Grant County with nearby schools including Westview Elementary School, Northview Elementary School, and R.J. Baskett Middle School.
Ownership History
Date
Name
Owned For
Owner Type
Purchase Details
Closed on
Feb 1, 2021
Sold by
Ray Marie Est
Bought by
Lee-Hatfield Joshua and Hatfield Connie C
Current Estimated Value
Home Financials for this Owner
Home Financials are based on the most recent Mortgage that was taken out on this home.
Original Mortgage
$60,000
Outstanding Balance
$34,425
Interest Rate
2.6%
Mortgage Type
Stand Alone Refi Refinance Of Original Loan
Estimated Equity
$154,037
Create a Home Valuation Report for This Property
The Home Valuation Report is an in-depth analysis detailing your home's value as well as a comparison with similar homes in the area
Home Values in the Area
Average Home Value in this Area
Purchase History
| Date | Buyer | Sale Price | Title Company |
|---|---|---|---|
| Lee-Hatfield Joshua | $100,000 | None Available |
Source: Public Records
Mortgage History
| Date | Status | Borrower | Loan Amount |
|---|---|---|---|
| Open | Lee-Hatfield Joshua | $60,000 |
Source: Public Records
Tax History Compared to Growth
Tax History
| Year | Tax Paid | Tax Assessment Tax Assessment Total Assessment is a certain percentage of the fair market value that is determined by local assessors to be the total taxable value of land and additions on the property. | Land | Improvement |
|---|---|---|---|---|
| 2024 | $3,336 | $166,800 | $26,900 | $139,900 |
| 2023 | $2,832 | $141,600 | $26,900 | $114,700 |
| 2022 | $2,444 | $122,200 | $23,400 | $98,800 |
| 2021 | $2,326 | $116,300 | $23,400 | $92,900 |
| 2020 | $221 | $110,900 | $23,400 | $87,500 |
| 2019 | $253 | $108,000 | $23,400 | $84,600 |
| 2018 | $248 | $104,600 | $21,500 | $83,100 |
| 2017 | $244 | $101,400 | $21,500 | $79,900 |
| 2016 | $239 | $102,400 | $21,500 | $80,900 |
| 2014 | $230 | $92,200 | $20,200 | $72,000 |
| 2013 | $230 | $89,900 | $19,400 | $70,500 |
Source: Public Records
Map
Nearby Homes
- 313 E South B St
- 312 E North C St
- 219 E South A St
- 521 E North A St
- 416 E South C St
- 0 E Farmington Tract 3
- 614 E South A St
- 416 E South D St
- 408 Walnut Dr
- 316 S 1st St
- 120 W North A St
- 624 E South F St
- 117 W North F St
- 128 W North St E
- 217 N 10th St
- 1131a E Main St
- 804 S 10th St
- 14 Cobblestone Blvd
- 20 Cobblestone Blvd
- 1205 Trace Ave
- 335 E Main St
- 327 E Main St
- 320 E North A St
- 316 E North A St
- 407 E Main St
- 314 E North A St
- 344 E Main St
- 404 E North A St
- 326 E Main St
- 419 E Main St
- 401 E North A St
- 325 E North A St
- 321 E South A St
- 319 E South A St
- 315 E South A St
- 311 E North A St
- 311 E South A St
- 407 E North A St
- 309 E North A St
- 309 E South A St