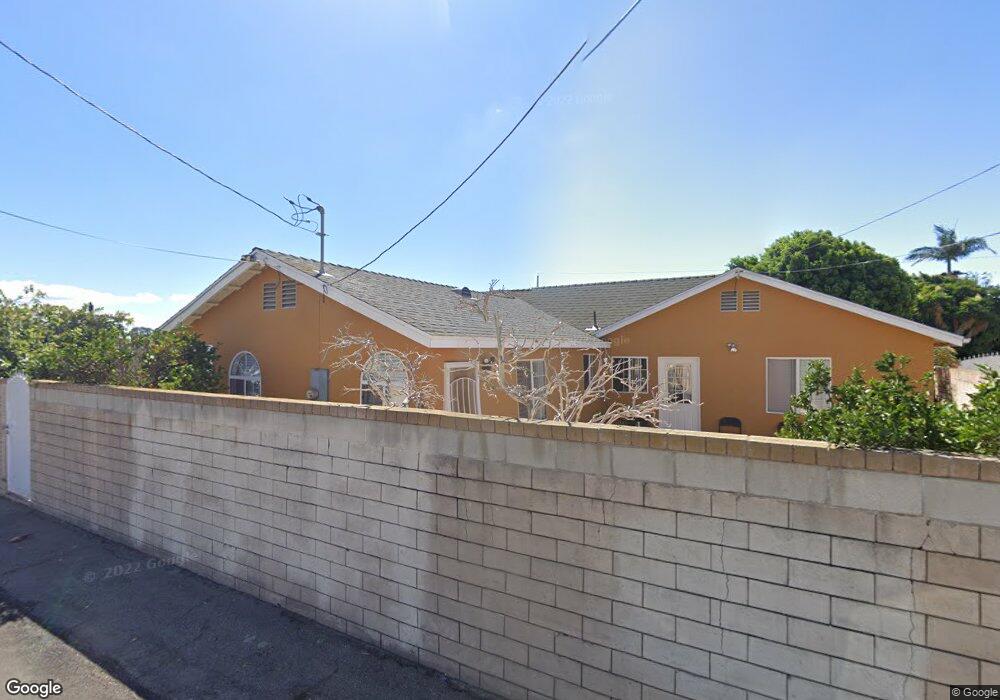
339 E Maple St Oxnard, CA 93033
Cal-Gisler NeighborhoodEstimated Value: $683,000 - $866,000
6
Beds
4
Baths
2,130
Sq Ft
$361/Sq Ft
Est. Value
About This Home
This home is located at 339 E Maple St, Oxnard, CA 93033 and is currently estimated at $769,710, approximately $361 per square foot. 339 E Maple St is a home located in Ventura County with nearby schools including Harrington Elementary School, R.J. Frank Academy of Marine Science & Engineering, and Channel Islands High School.
Ownership History
Date
Name
Owned For
Owner Type
Purchase Details
Closed on
Aug 22, 2022
Sold by
Gomez Lorenzo and Ortiz Margarita
Bought by
Barajas Ortiz Trust and Barajas
Current Estimated Value
Purchase Details
Closed on
Nov 22, 1999
Sold by
Lucila Gomez
Bought by
Gomez Lorenzo and Ortiz Margarita
Purchase Details
Closed on
Nov 14, 1999
Sold by
Duenas David Solis
Bought by
Gomez Lorenzo and Ortiz Margarita
Purchase Details
Closed on
Apr 4, 1997
Sold by
Kazuma Kato
Bought by
Gomez Lorenzo and Ortiz Margarita
Home Financials for this Owner
Home Financials are based on the most recent Mortgage that was taken out on this home.
Original Mortgage
$135,583
Interest Rate
8.13%
Mortgage Type
FHA
Create a Home Valuation Report for This Property
The Home Valuation Report is an in-depth analysis detailing your home's value as well as a comparison with similar homes in the area
Home Values in the Area
Average Home Value in this Area
Purchase History
| Date | Buyer | Sale Price | Title Company |
|---|---|---|---|
| Barajas Ortiz Trust | -- | None Listed On Document | |
| Gomez Lorenzo | -- | -- | |
| Gomez Lorenzo | -- | -- | |
| Gomez Lorenzo | $137,500 | American Title Co |
Source: Public Records
Mortgage History
| Date | Status | Borrower | Loan Amount |
|---|---|---|---|
| Previous Owner | Gomez Lorenzo | $135,583 |
Source: Public Records
Tax History
| Year | Tax Paid | Tax Assessment Tax Assessment Total Assessment is a certain percentage of the fair market value that is determined by local assessors to be the total taxable value of land and additions on the property. | Land | Improvement |
|---|---|---|---|---|
| 2025 | $3,846 | $314,426 | $89,557 | $224,869 |
| 2024 | $3,846 | $308,261 | $87,801 | $220,460 |
| 2023 | $3,706 | $302,217 | $86,079 | $216,138 |
| 2022 | $3,512 | $296,292 | $84,392 | $211,900 |
| 2021 | $3,483 | $290,483 | $82,737 | $207,746 |
| 2020 | $3,546 | $287,507 | $81,890 | $205,617 |
| 2019 | $3,445 | $281,871 | $80,285 | $201,586 |
| 2018 | $3,395 | $276,345 | $78,711 | $197,634 |
| 2017 | $3,222 | $270,927 | $77,168 | $193,759 |
| 2016 | $3,109 | $265,615 | $75,655 | $189,960 |
| 2015 | $3,140 | $261,626 | $74,519 | $187,107 |
| 2014 | $3,104 | $256,503 | $73,060 | $183,443 |
Source: Public Records
Map
Nearby Homes
- 225 W Iris St
- 3151 Fournier St
- 3130 Paula St
- 3631 La Costa Place
- 2024 S J St
- 3638 S B St
- 360 Ibsen Place Unit 129
- 860 Morro Way
- 1239 S C St
- 140 Gaviota Place Unit 157
- 1127 S C St
- 4160 Petit Dr Unit 39
- 320 Columbia Place Unit 46
- 280 Columbia Place Unit 48
- 4029 S B St
- 775 Thayer Ln
- 1140 Teakwood St
- 3820 S J St
- 4200 S A St
- 1928 San Benito St
- 329 E Maple St
- 344 E Laurel St
- 354 E Laurel St
- 319 E Maple St
- 334 E Laurel St
- 362 E Laurel St
- 334 E Maple St
- 324 E Maple St
- 324 E Laurel St
- 309 E Maple St
- 404 E Laurel St
- 314 E Maple St
- 314 E Laurel St
- 414 E Laurel St
- 249 E Maple St
- 304 E Maple St
- 333 Nectarine St
- 345 E Laurel St
- 355 E Laurel St
- 304 E Laurel St
Your Personal Tour Guide
Ask me questions while you tour the home.