


339 E St Unit 1 Boston, MA 02127
South Boston Neighborhood
2
Beds
1
Bath
683
Sq Ft
871
Sq Ft Lot
Highlights
- Wood Flooring
- Forced Air Heating and Cooling System
- 1-minute walk to Buckley Playground
- Intercom
About This Home
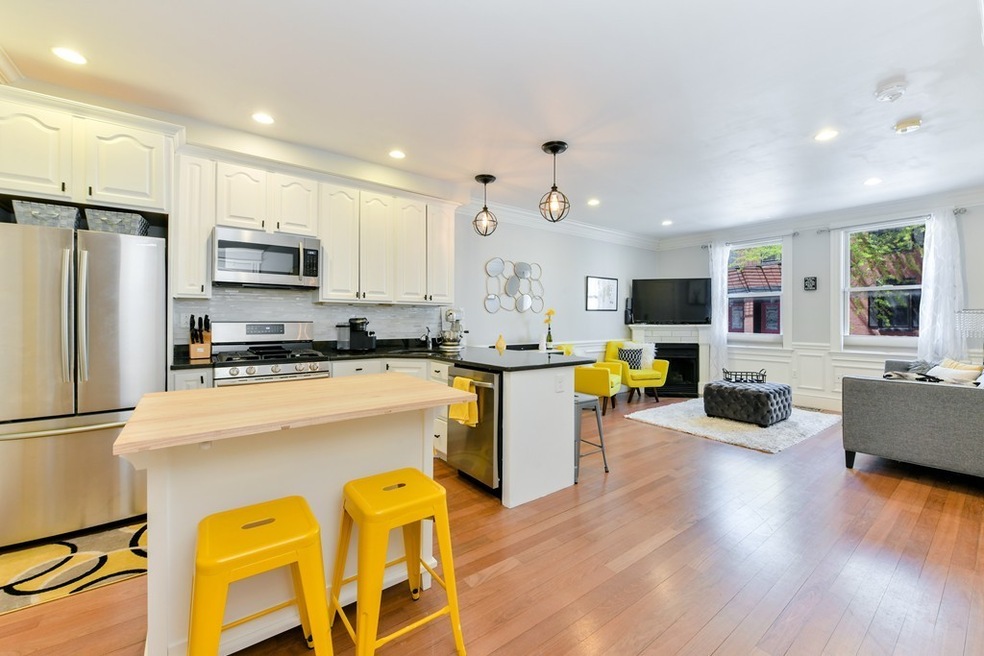
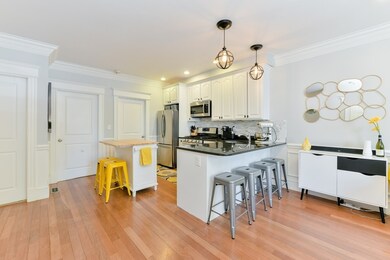
As of August 2020Rarely available in Southie for under 620k!!! This well thought out 2 bedroom condominium features a well appointed, renovated bath with jacuzzi tub, open-eat in kitchen with granite counter-tops, stainless steel appliances, white custom kitchen cabinetry and breakfast bar. Along with recently refinished hardwood floors, central air, in unit laundry, and impressive moldings and millwork throughout, this pet friendly association also features an exceptional amount of storage both inside the unit and a 10 X 12 exclusive storage area. To top it off this impressive condominium offers a private fenced-in outdoor oasis which is perfect for entertaining and for your furry friends. Being centrally located one block from West Broadway, short walk to sandy beaches, Seaport & public transit making this residence a perfect investment property or pied-a-terre. Very proactive association with high reserves.
Property Details
Home Type
- Condominium
Est. Annual Taxes
- $7,329
Year Built
- Built in 1885
Lot Details
- Year Round Access
Kitchen
- Range
- Microwave
- Freezer
- Dishwasher
- Disposal
Flooring
- Wood
- Tile
Laundry
- Dryer
- Washer
Utilities
- Forced Air Heating and Cooling System
- Heat Pump System
- Heating System Uses Gas
- Natural Gas Water Heater
- Cable TV Available
Additional Features
- Basement
Community Details
- Call for details about the types of pets allowed
Listing and Financial Details
- Assessor Parcel Number W:06 P:01644 S:002
Ownership History
Date
Name
Owned For
Owner Type
Purchase Details
Closed on
Oct 12, 2021
Sold by
Mulrean Joan M
Bought by
Brennan Susan M and Mulrean Joan M
Current Estimated Value
Purchase Details
Listed on
May 26, 2020
Closed on
Jun 8, 2020
Sold by
Fleser Stacy
Bought by
Mulrean Joan M
Seller's Agent
Jonathon Curley
Compass
Buyer's Agent
Michelle Talbot
Grove Property Group
List Price
$619,900
Sold Price
$610,000
Premium/Discount to List
-$9,900
-1.6%
Home Financials for this Owner
Home Financials are based on the most recent Mortgage that was taken out on this home.
Avg. Annual Appreciation
2.39%
Purchase Details
Listed on
Jan 7, 2019
Closed on
Feb 21, 2019
Sold by
Curry Thomas
Bought by
Fleser Stacy
Seller's Agent
Emily Ingardia
Donnelly + Co.
Buyer's Agent
Jonathon Curley
Compass
List Price
$575,000
Sold Price
$565,000
Premium/Discount to List
-$10,000
-1.74%
Home Financials for this Owner
Home Financials are based on the most recent Mortgage that was taken out on this home.
Avg. Annual Appreciation
5.59%
Original Mortgage
$452,000
Interest Rate
4.4%
Mortgage Type
New Conventional
Purchase Details
Listed on
Mar 31, 2016
Closed on
Jun 15, 2016
Sold by
Douglas-Wilkins Heather and Jensen-Wilkins Eric
Bought by
Curry Thomas
Seller's Agent
Poppy Troupe
Coldwell Banker Realty - Norwell - Hanover Regional Office
Buyer's Agent
Emily Ingardia
Donnelly + Co.
List Price
$449,000
Sold Price
$476,500
Premium/Discount to List
$27,500
6.12%
Home Financials for this Owner
Home Financials are based on the most recent Mortgage that was taken out on this home.
Avg. Annual Appreciation
6.44%
Original Mortgage
$381,200
Interest Rate
3.61%
Mortgage Type
New Conventional
Purchase Details
Listed on
Dec 4, 2013
Closed on
Feb 14, 2014
Sold by
Doherty Chelsea and Doherty Daniel
Bought by
Wilkins Heather D and Wilkins Douglas Heather
Seller's Agent
Brian Montgomery
Compass
Buyer's Agent
Jillian Reig
Coldwell Banker Realty - Boston
List Price
$409,000
Sold Price
$400,000
Premium/Discount to List
-$9,000
-2.2%
Home Financials for this Owner
Home Financials are based on the most recent Mortgage that was taken out on this home.
Avg. Annual Appreciation
7.80%
Original Mortgage
$360,000
Interest Rate
3%
Mortgage Type
New Conventional
Purchase Details
Listed on
Jul 25, 2011
Closed on
May 16, 2012
Sold by
Croke Janine M and Clifford Nathan
Bought by
Benson Chelsea M
Seller's Agent
Josh Parra
Etiquette Realty
Buyer's Agent
Brian Montgomery
Compass
List Price
$315,000
Sold Price
$320,000
Premium/Discount to List
$5,000
1.59%
Home Financials for this Owner
Home Financials are based on the most recent Mortgage that was taken out on this home.
Avg. Annual Appreciation
13.60%
Original Mortgage
$288,000
Interest Rate
3%
Mortgage Type
New Conventional
Purchase Details
Closed on
Mar 30, 2007
Sold by
339 E Street Llc
Bought by
Croke Janine M and Clifford Nathan
Home Financials for this Owner
Home Financials are based on the most recent Mortgage that was taken out on this home.
Original Mortgage
$295,000
Interest Rate
6.33%
Mortgage Type
Purchase Money Mortgage
Similar Homes in the area
Create a Home Valuation Report for This Property
The Home Valuation Report is an in-depth analysis detailing your home's value as well as a comparison with similar homes in the area
Home Values in the Area
Average Home Value in this Area
Purchase History
| Date | Type | Sale Price | Title Company |
|---|---|---|---|
| Quit Claim Deed | -- | None Available | |
| Not Resolvable | $610,000 | None Available | |
| Not Resolvable | $565,000 | -- | |
| Not Resolvable | $476,500 | -- | |
| Deed | $400,000 | -- | |
| Deed | $320,000 | -- | |
| Deed | $295,000 | -- |
Source: Public Records
Mortgage History
| Date | Status | Loan Amount | Loan Type |
|---|---|---|---|
| Previous Owner | $452,000 | New Conventional | |
| Previous Owner | $381,200 | New Conventional | |
| Previous Owner | $360,000 | New Conventional | |
| Previous Owner | $288,000 | New Conventional | |
| Previous Owner | $295,000 | Purchase Money Mortgage |
Source: Public Records
Property History
| Date | Event | Price | Change | Sq Ft Price |
|---|---|---|---|---|
| 08/03/2020 08/03/20 | Sold | $610,000 | -1.6% | $893 / Sq Ft |
| 06/01/2020 06/01/20 | Pending | -- | -- | -- |
| 05/26/2020 05/26/20 | For Sale | $619,900 | +9.7% | $908 / Sq Ft |
| 03/07/2019 03/07/19 | Sold | $565,000 | -1.7% | $827 / Sq Ft |
| 01/28/2019 01/28/19 | Pending | -- | -- | -- |
| 01/07/2019 01/07/19 | For Sale | $575,000 | +20.7% | $842 / Sq Ft |
| 06/15/2016 06/15/16 | Sold | $476,500 | +6.1% | $698 / Sq Ft |
| 04/06/2016 04/06/16 | Pending | -- | -- | -- |
| 03/31/2016 03/31/16 | For Sale | $449,000 | +12.3% | $657 / Sq Ft |
| 02/14/2014 02/14/14 | Sold | $400,000 | 0.0% | $563 / Sq Ft |
| 01/17/2014 01/17/14 | Pending | -- | -- | -- |
| 12/20/2013 12/20/13 | Off Market | $400,000 | -- | -- |
| 12/04/2013 12/04/13 | For Sale | $409,000 | +27.8% | $576 / Sq Ft |
| 05/16/2012 05/16/12 | Sold | $320,000 | +0.3% | $469 / Sq Ft |
| 03/27/2012 03/27/12 | Pending | -- | -- | -- |
| 03/07/2012 03/07/12 | Price Changed | $319,000 | +1.3% | $467 / Sq Ft |
| 01/03/2012 01/03/12 | For Sale | $315,000 | -1.6% | $461 / Sq Ft |
| 12/31/2011 12/31/11 | Off Market | $320,000 | -- | -- |
| 10/25/2011 10/25/11 | Price Changed | $315,000 | -1.3% | $461 / Sq Ft |
| 09/11/2011 09/11/11 | Price Changed | $319,000 | -1.8% | $467 / Sq Ft |
| 07/24/2011 07/24/11 | For Sale | $324,900 | -- | $476 / Sq Ft |
Source: MLS Property Information Network (MLS PIN)
Tax History Compared to Growth
Tax History
| Year | Tax Paid | Tax Assessment Tax Assessment Total Assessment is a certain percentage of the fair market value that is determined by local assessors to be the total taxable value of land and additions on the property. | Land | Improvement |
|---|---|---|---|---|
| 2025 | $7,329 | $632,900 | $0 | $632,900 |
| 2024 | $6,702 | $614,900 | $0 | $614,900 |
| 2023 | $6,411 | $596,900 | $0 | $596,900 |
| 2022 | $6,306 | $579,600 | $0 | $579,600 |
| 2021 | $5,622 | $526,900 | $0 | $526,900 |
| 2020 | $5,186 | $491,100 | $0 | $491,100 |
| 2019 | $4,794 | $454,800 | $0 | $454,800 |
| 2018 | $4,497 | $429,100 | $0 | $429,100 |
| 2017 | $4,185 | $395,200 | $0 | $395,200 |
| 2016 | $4,140 | $376,400 | $0 | $376,400 |
| 2015 | $3,889 | $321,100 | $0 | $321,100 |
| 2014 | $3,605 | $286,600 | $0 | $286,600 |
Source: Public Records
Agents Affiliated with this Home
-
Seller's Agent in 2020
Jonathon Curley
Compass
(781) 258-7996
8 in this area
62 Total Sales
-
Buyer's Agent in 2020
Michelle Talbot
Grove Property Group
(617) 596-1948
6 in this area
15 Total Sales
-
Seller's Agent in 2019
Emily Ingardia
Donnelly + Co.
(617) 480-9976
5 in this area
71 Total Sales
-
E
Seller Co-Listing Agent in 2019
Erin Loughran
Donnelly + Co.
(508) 265-8298
8 in this area
42 Total Sales
-
Seller's Agent in 2016
Poppy Troupe
Coldwell Banker Realty - Norwell - Hanover Regional Office
(617) 285-5684
239 Total Sales
-
B
Seller's Agent in 2014
Brian Montgomery
Compass
Map
Source: MLS Property Information Network (MLS PIN)
MLS Number: 72661544
APN: SBOS-000000-000006-001644-000002
Disclaimer: Certain information contained herein is derived from information provided by parties other than Homes.com. All information provided is deemed reliable, but is not guaranteed to be accurate and should be independently verified.
![]() The property listing data and information, or the Images, set forth herein were provided to MLS Property Information Network, Inc. from third party sources, including sellers, lessors and public records, and were compiled by MLS Property Information Network, Inc. The property listing data and information, and the Images, are for the personal, non-commercial use of consumers having a good faith interest in purchasing or leasing listed properties of the type displayed to them and may not be used for any purpose other than to identify prospective properties which such consumers may have a good faith interest in purchasing or leasing. MLS Property Information Network, Inc. and its subscribers disclaim any and all representations and warranties as to the accuracy of the property listing data and information, or as to the accuracy of any of the Images, set forth herein.
The property listing data and information, or the Images, set forth herein were provided to MLS Property Information Network, Inc. from third party sources, including sellers, lessors and public records, and were compiled by MLS Property Information Network, Inc. The property listing data and information, and the Images, are for the personal, non-commercial use of consumers having a good faith interest in purchasing or leasing listed properties of the type displayed to them and may not be used for any purpose other than to identify prospective properties which such consumers may have a good faith interest in purchasing or leasing. MLS Property Information Network, Inc. and its subscribers disclaim any and all representations and warranties as to the accuracy of the property listing data and information, or as to the accuracy of any of the Images, set forth herein.
Nearby Homes
- 253 W 3rd St
- 253 W 3rd St Unit 253
- 9 W Broadway Unit 106
- 9 W Broadway Unit 423
- 321 W Broadway Unit 6
- 309 E St Unit 25
- 309 E St Unit 23
- 350 W 4th St Unit 103
- 350 W 4th St Unit 313
- 335-337 W 2nd St Unit 2
- 320 W 2nd St Unit 403
- 314 W 4th St Unit 1
- 340 W 2nd St Unit 13
- 340 W 2nd St Unit 19
- 340 W 2nd St Unit 17
- 340 W 2nd St
- 420 W Broadway Unit 409
- 420 W Broadway Unit 604
- 121 F St Unit 1
- 360 W 2nd St Unit 6