Estimated Value: $93,000 - $203,000
Studio
2
Baths
1,369
Sq Ft
$108/Sq Ft
Est. Value
About This Home
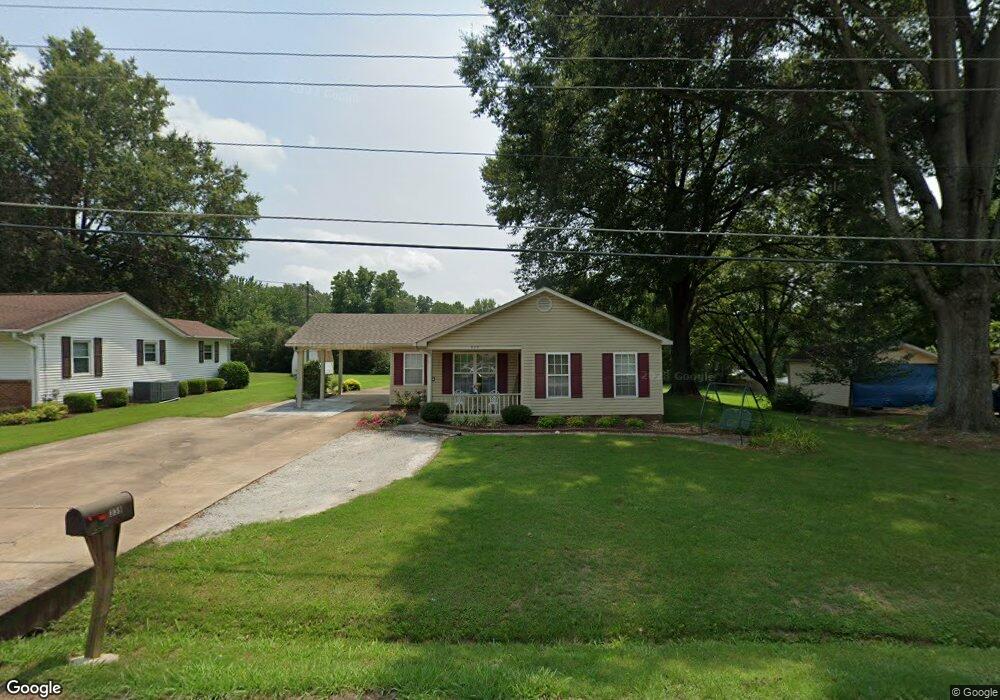
This home is located at 339 E Walnut St, Dyer, TN 38330 and is currently estimated at $147,648, approximately $107 per square foot. 339 E Walnut St is a home located in Gibson County with nearby schools including Dyer Elementary School and Gibson County High School.
Ownership History
Date
Name
Owned For
Owner Type
Purchase Details
Closed on
Sep 19, 2025
Sold by
Ramsey Joshua F and Ramsey Rhonda
Bought by
Ramsey Joshua and Ramsey Rhonda
Current Estimated Value
Purchase Details
Closed on
Nov 17, 2000
Sold by
Holloway Randy
Bought by
Ramsey Joshua F
Purchase Details
Closed on
Mar 27, 2000
Sold by
Jewell Austin
Bought by
Holloway Randy
Purchase Details
Closed on
Jun 11, 1962
Bought by
Jewell Austin and Jewell Margaret
Create a Home Valuation Report for This Property
The Home Valuation Report is an in-depth analysis detailing your home's value as well as a comparison with similar homes in the area
Purchase History
| Date | Buyer | Sale Price | Title Company |
|---|---|---|---|
| Ramsey Joshua | -- | None Listed On Document | |
| Ramsey Joshua F | $70,900 | -- | |
| Holloway Randy | $10,000 | -- | |
| Jewell Austin | -- | -- |
Source: Public Records
Tax History
| Year | Tax Paid | Tax Assessment Tax Assessment Total Assessment is a certain percentage of the fair market value that is determined by local assessors to be the total taxable value of land and additions on the property. | Land | Improvement |
|---|---|---|---|---|
| 2025 | $1,321 | $36,525 | $3,750 | $32,775 |
| 2024 | $1,266 | $36,525 | $3,750 | $32,775 |
| 2023 | $721 | $23,175 | $2,425 | $20,750 |
| 2022 | $705 | $23,175 | $2,425 | $20,750 |
| 2021 | $705 | $23,175 | $2,425 | $20,750 |
| 2020 | $1,152 | $23,175 | $2,425 | $20,750 |
| 2019 | $1,147 | $23,100 | $2,425 | $20,675 |
| 2018 | $1,151 | $22,800 | $2,425 | $20,375 |
| 2017 | $1,106 | $22,800 | $2,425 | $20,375 |
| 2016 | $1,106 | $22,800 | $2,425 | $20,375 |
| 2015 | $1,007 | $22,800 | $2,425 | $20,375 |
| 2014 | $1,007 | $22,800 | $2,425 | $20,375 |
Source: Public Records
Map
Nearby Homes
- 342 E Walnut St
- 217 Central St
- 303 E Walnut St
- 299 E Walnut St
- 354 E Maple St
- 298 High St
- 139 Peach St
- 295 E College St
- 403 E College St
- 115 High St
- 163 Monroe St
- 226 Madison St
- 205 Division St
- 508 E College St
- 246 Thomas St
- 208 & 210 Lee St
- 148 Scattered Acres Loop
- 23 Gravettes Crossing Rd W
- 254 Tennessee 185
- 314 New Hope Rd
Your Personal Tour Guide
Ask me questions while you tour the home.