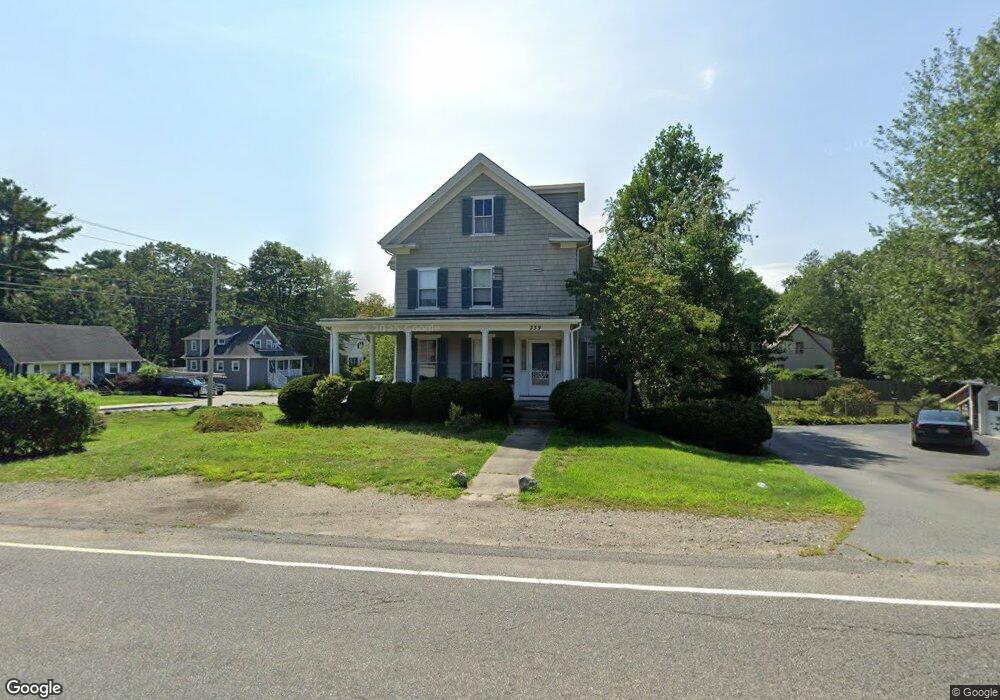
339 Front St Weymouth, MA 02188
Weymouth Landing NeighborhoodEstimated Value: $745,349 - $918,000
--
Bed
3
Baths
3,043
Sq Ft
$266/Sq Ft
Est. Value
About This Home
This home is located at 339 Front St, Weymouth, MA 02188 and is currently estimated at $808,837, approximately $265 per square foot. 339 Front St is a home located in Norfolk County with nearby schools including Frederick C Murphy, Abigail Adams Middle School, and Weymouth Middle School Chapman.
Ownership History
Date
Name
Owned For
Owner Type
Purchase Details
Closed on
Dec 22, 2008
Sold by
Mehrman Irene L
Bought by
Rim Rt
Current Estimated Value
Purchase Details
Closed on
Oct 22, 1990
Sold by
Johnson Admr Anna G
Bought by
Mehrman Robert J
Home Financials for this Owner
Home Financials are based on the most recent Mortgage that was taken out on this home.
Original Mortgage
$65,000
Interest Rate
10.14%
Mortgage Type
Purchase Money Mortgage
Create a Home Valuation Report for This Property
The Home Valuation Report is an in-depth analysis detailing your home's value as well as a comparison with similar homes in the area
Home Values in the Area
Average Home Value in this Area
Purchase History
| Date | Buyer | Sale Price | Title Company |
|---|---|---|---|
| Rim Rt | -- | -- | |
| Mehrman Robert J | $135,000 | -- |
Source: Public Records
Mortgage History
| Date | Status | Borrower | Loan Amount |
|---|---|---|---|
| Previous Owner | Mehrman Robert J | $65,000 |
Source: Public Records
Tax History Compared to Growth
Tax History
| Year | Tax Paid | Tax Assessment Tax Assessment Total Assessment is a certain percentage of the fair market value that is determined by local assessors to be the total taxable value of land and additions on the property. | Land | Improvement |
|---|---|---|---|---|
| 2025 | $6,581 | $651,600 | $215,200 | $436,400 |
| 2024 | $6,376 | $620,800 | $205,000 | $415,800 |
| 2023 | $6,187 | $592,100 | $189,800 | $402,300 |
| 2022 | $5,994 | $523,000 | $175,700 | $347,300 |
| 2021 | $5,734 | $488,400 | $175,700 | $312,700 |
| 2020 | $5,616 | $471,100 | $175,700 | $295,400 |
| 2019 | $5,477 | $451,900 | $169,000 | $282,900 |
| 2018 | $5,020 | $401,600 | $160,900 | $240,700 |
| 2017 | $4,200 | $327,900 | $153,300 | $174,600 |
| 2016 | $4,047 | $316,200 | $147,400 | $168,800 |
| 2015 | $3,978 | $308,400 | $147,400 | $161,000 |
| 2014 | $3,994 | $300,300 | $137,200 | $163,100 |
Source: Public Records
Map
Nearby Homes
- 54 Federal St
- 24 Blake Rd
- 33 Congress St
- 76 Kingman St
- 16 Lindbergh Ave
- 23-25 Lindbergh Ave
- 15 Summer St
- 19 Vine St Unit 3
- 19 Vine St Unit 1
- 114 Broad St Unit D
- 114 Broad St Unit C
- 11 Richmond St
- 200 Justin Dr Unit 3
- 122 Washington St Unit 22
- 42 Sundin Rd
- 286 Broad St
- 12 Klasson Ln
- 286 Essex St
- 449 Middle St
- 215 Winter St Unit 1P