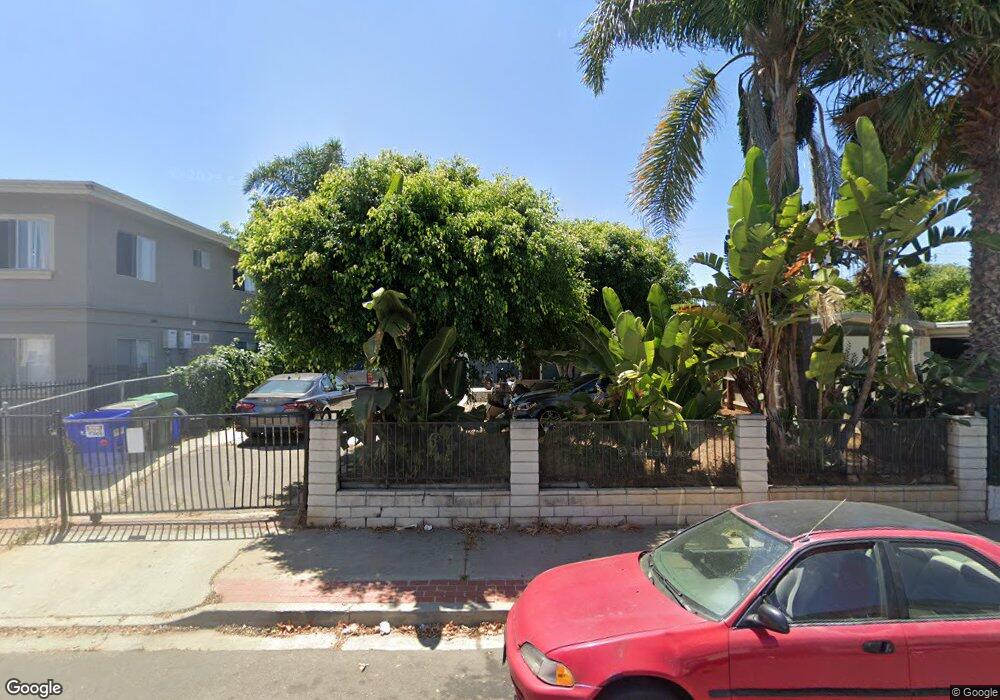
339 Garfield St Oceanside, CA 92054
Downtown Oceanside NeighborhoodEstimated Value: $954,717 - $1,229,000
3
Beds
2
Baths
1,086
Sq Ft
$961/Sq Ft
Est. Value
About This Home
This home is located at 339 Garfield St, Oceanside, CA 92054 and is currently estimated at $1,044,179, approximately $961 per square foot. 339 Garfield St is a home located in San Diego County with nearby schools including Mission Elementary School, Lincoln Middle School, and Oceanside High School.
Ownership History
Date
Name
Owned For
Owner Type
Purchase Details
Closed on
Aug 29, 2019
Sold by
Peppe Nani Shelly and Nani Terence
Bought by
Nani Terence and Peppe Nani Shelly
Current Estimated Value
Purchase Details
Closed on
Nov 23, 2011
Sold by
Federal National Mortgage Association
Bought by
Peppe Shelly A and Nani Terence R
Home Financials for this Owner
Home Financials are based on the most recent Mortgage that was taken out on this home.
Original Mortgage
$180,000
Outstanding Balance
$122,267
Interest Rate
3.94%
Mortgage Type
New Conventional
Estimated Equity
$921,912
Purchase Details
Closed on
Mar 10, 2010
Sold by
Moreno Mercedes
Bought by
Federal National Mortgage Association
Purchase Details
Closed on
Oct 19, 2009
Sold by
Oceanview Investors Llc
Bought by
Moreno Mercedes
Purchase Details
Closed on
Jan 24, 2008
Sold by
Moreno Mercedes
Bought by
Oceanview Investors Llc
Purchase Details
Closed on
Jan 25, 2003
Sold by
Moreno Mercedes
Bought by
Moreno Mercedes
Purchase Details
Closed on
Jan 19, 2001
Sold by
Alex Delossantos
Bought by
Moreno Mercedes
Purchase Details
Closed on
Jan 5, 1998
Sold by
Devenberg Martin F and Living Barbara L
Bought by
Delossantos Alex
Home Financials for this Owner
Home Financials are based on the most recent Mortgage that was taken out on this home.
Original Mortgage
$76,960
Interest Rate
7%
Mortgage Type
FHA
Purchase Details
Closed on
Jun 14, 1995
Sold by
Smith Barbara E
Bought by
Devenberg Martin F and Devenberg Barbara L
Home Financials for this Owner
Home Financials are based on the most recent Mortgage that was taken out on this home.
Original Mortgage
$41,400
Interest Rate
7.88%
Mortgage Type
Seller Take Back
Purchase Details
Closed on
Apr 23, 1990
Create a Home Valuation Report for This Property
The Home Valuation Report is an in-depth analysis detailing your home's value as well as a comparison with similar homes in the area
Home Values in the Area
Average Home Value in this Area
Purchase History
| Date | Buyer | Sale Price | Title Company |
|---|---|---|---|
| Nani Terence | -- | None Available | |
| Peppe Shelly A | $225,000 | Stewart Title Of California | |
| Federal National Mortgage Association | $347,623 | Landsafe Title | |
| Moreno Mercedes | -- | Stewart Title Of Ca Inc | |
| Oceanview Investors Llc | -- | None Available | |
| Moreno Mercedes | -- | -- | |
| Moreno Mercedes | -- | Commonwealth Land Title Co | |
| Delossantos Alex | $75,000 | California Title Company | |
| Devenberg Martin F | $46,000 | South Coast Title Company | |
| -- | $100,000 | -- |
Source: Public Records
Mortgage History
| Date | Status | Borrower | Loan Amount |
|---|---|---|---|
| Open | Peppe Shelly A | $180,000 | |
| Previous Owner | Delossantos Alex | $76,960 | |
| Previous Owner | Devenberg Martin F | $41,400 |
Source: Public Records
Tax History Compared to Growth
Tax History
| Year | Tax Paid | Tax Assessment Tax Assessment Total Assessment is a certain percentage of the fair market value that is determined by local assessors to be the total taxable value of land and additions on the property. | Land | Improvement |
|---|---|---|---|---|
| 2025 | $3,149 | $282,599 | $219,803 | $62,796 |
| 2024 | $3,149 | $277,059 | $215,494 | $61,565 |
| 2023 | $3,052 | $271,627 | $211,269 | $60,358 |
| 2022 | $3,006 | $266,302 | $207,127 | $59,175 |
| 2021 | $3,018 | $261,081 | $203,066 | $58,015 |
| 2020 | $2,925 | $258,405 | $200,984 | $57,421 |
| 2019 | $2,841 | $253,340 | $197,044 | $56,296 |
| 2018 | $2,811 | $248,374 | $193,181 | $55,193 |
| 2017 | $2,760 | $243,505 | $189,394 | $54,111 |
| 2016 | $2,670 | $238,731 | $185,681 | $53,050 |
| 2015 | $2,593 | $235,146 | $182,892 | $52,254 |
| 2014 | $2,494 | $230,541 | $179,310 | $51,231 |
Source: Public Records
Map
Nearby Homes
- 326 Grant St
- 1223 Division St
- 520 Grant St
- 301 S Horne St
- 608-14 Garfield St
- 324 S Nevada St
- 109 S Horne St
- 1767 Ragtime Way
- 722 &718 N Freeman St
- 410 S Freeman St Unit 10
- 1346 Bush St
- 1786 Jasmine Way
- 1104 Hibiscus Way
- 415 Bush St
- 321 S Freeman St
- 110 S Freeman St
- 1120 Sea Glass Way
- 1121 Makena Way
- 525 S Freeman St
- 909 Leonard Ave
- 341 Garfield St
- 333 Garfield St
- 345 Garfield St
- 329 Garfield St
- 338 Grant St
- 344 Grant St
- 334 1/2 Grant St
- 334 Grant St
- 325 Garfield St
- 344 Garfield St
- 1310 Division St
- 336 Garfield St
- 330 Grant St
- 346 Garfield St
- 334 Grant St
- 330 Garfield St Unit 32
- 321 Garfield St Unit 23
- 326 Garfield St
- 324 Garfield St Unit A
- 324 Garfield St
