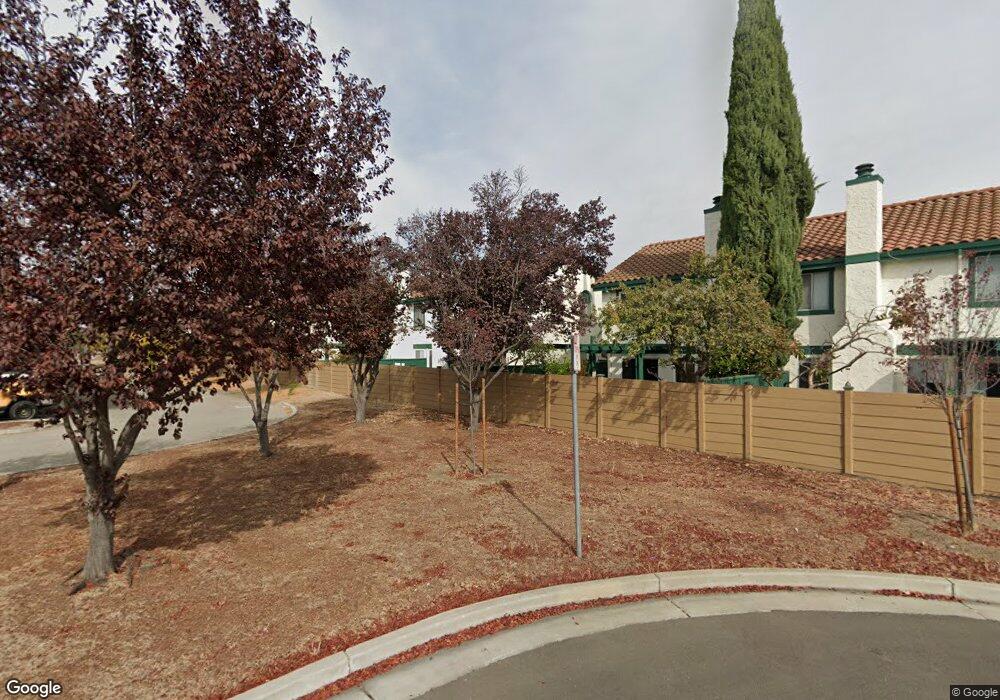
339 Hans Way San Jose, CA 95133
Commodore NeighborhoodEstimated Value: $855,000 - $1,013,000
3
Beds
3
Baths
1,404
Sq Ft
$654/Sq Ft
Est. Value
About This Home
This home is located at 339 Hans Way, San Jose, CA 95133 and is currently estimated at $918,062, approximately $653 per square foot. 339 Hans Way is a home located in Santa Clara County with nearby schools including Ben Painter Elementary School, William Sheppard Middle School, and Independence High School.
Ownership History
Date
Name
Owned For
Owner Type
Purchase Details
Closed on
Sep 30, 2022
Sold by
Chun Chih Huang Helen
Bought by
Yei Grace H
Current Estimated Value
Purchase Details
Closed on
Mar 4, 2005
Sold by
Huang Helen and Huang Helen Chun Chih
Bought by
Huang Helen Chun Chih
Purchase Details
Closed on
Jun 8, 1994
Sold by
Southwood Townhomes Group Inc
Bought by
Huang Helen
Home Financials for this Owner
Home Financials are based on the most recent Mortgage that was taken out on this home.
Original Mortgage
$112,450
Interest Rate
5%
Purchase Details
Closed on
May 18, 1994
Sold by
Huang Cary Jin Jei
Bought by
Huang Helen
Home Financials for this Owner
Home Financials are based on the most recent Mortgage that was taken out on this home.
Original Mortgage
$112,450
Interest Rate
5%
Purchase Details
Closed on
Jan 5, 1994
Sold by
Equitable Deed Company
Bought by
Ba Properties Inc
Create a Home Valuation Report for This Property
The Home Valuation Report is an in-depth analysis detailing your home's value as well as a comparison with similar homes in the area
Home Values in the Area
Average Home Value in this Area
Purchase History
| Date | Buyer | Sale Price | Title Company |
|---|---|---|---|
| Yei Grace H | -- | -- | |
| Huang Helen Chun Chih | -- | -- | |
| Huang Helen | $150,000 | First American Title Guarant | |
| Huang Helen | -- | First American Title Guarant | |
| Ba Properties Inc | $139,712 | Fidelity National Title Co |
Source: Public Records
Mortgage History
| Date | Status | Borrower | Loan Amount |
|---|---|---|---|
| Previous Owner | Huang Helen | $112,450 |
Source: Public Records
Tax History Compared to Growth
Tax History
| Year | Tax Paid | Tax Assessment Tax Assessment Total Assessment is a certain percentage of the fair market value that is determined by local assessors to be the total taxable value of land and additions on the property. | Land | Improvement |
|---|---|---|---|---|
| 2025 | $12,442 | $879,138 | $439,569 | $439,569 |
| 2024 | $12,442 | $861,900 | $430,950 | $430,950 |
| 2023 | $12,218 | $845,000 | $422,500 | $422,500 |
| 2022 | $4,663 | $237,394 | $79,125 | $158,269 |
| 2021 | $4,482 | $232,740 | $77,574 | $155,166 |
| 2020 | $4,360 | $230,354 | $76,779 | $153,575 |
| 2019 | $4,228 | $225,838 | $75,274 | $150,564 |
| 2018 | $4,159 | $221,411 | $73,799 | $147,612 |
| 2017 | $4,153 | $217,070 | $72,352 | $144,718 |
| 2016 | $3,926 | $212,815 | $70,934 | $141,881 |
| 2015 | $3,909 | $209,619 | $69,869 | $139,750 |
| 2014 | $3,450 | $205,514 | $68,501 | $137,013 |
Source: Public Records
Map
Nearby Homes
- 370 Englert Ct
- 230 Montclair Ave
- 295 Esmeralda Ct
- 210 Damsen Dr Unit 22
- 2420 Kita Ln
- 2432 Kita Ln
- 127 Schott St
- 559 Apricot Way
- 571 Apricot Way
- 1816 Luby Dr Unit 46
- 88 N Jackson Ave Unit 322
- 88 N Jackson Ave Unit 105
- 88 N Jackson Ave Unit 414
- 210 Gramercy Place
- 2580 Gimelli Way
- 750 Fruit Ranch Loop
- 633 Easton Dr
- 1999 Dobbin Dr
- 181 Alexander Ave
- 259 N Capitol Ave Unit 171