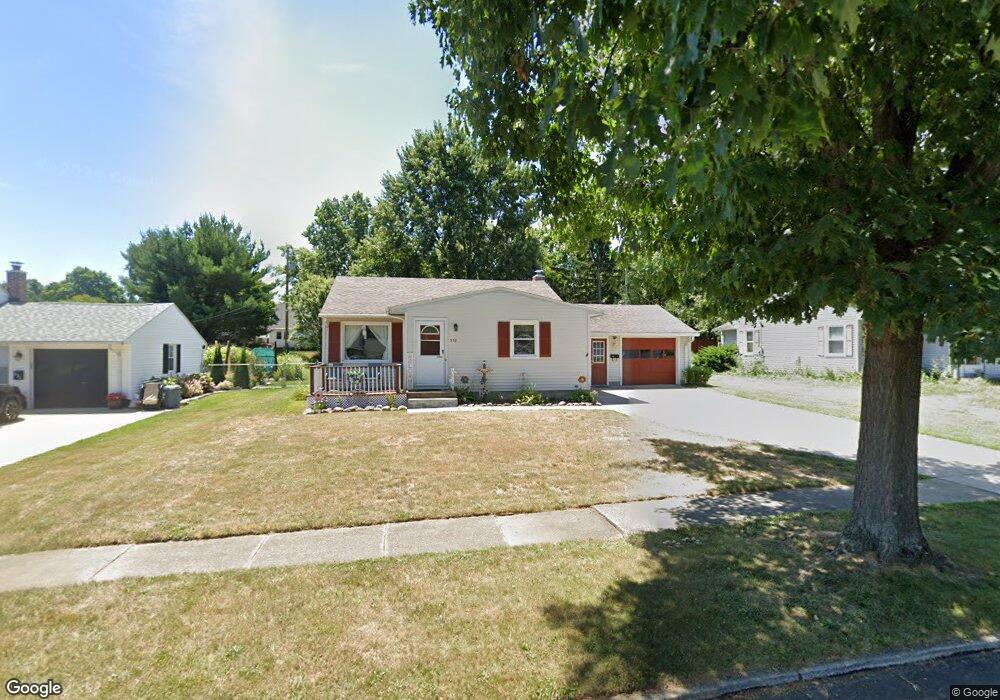
339 Keen Ave Ashland, OH 44805
Estimated Value: $159,000 - $171,159
2
Beds
1
Bath
960
Sq Ft
$173/Sq Ft
Est. Value
About This Home
This home is located at 339 Keen Ave, Ashland, OH 44805 and is currently estimated at $166,040, approximately $172 per square foot. 339 Keen Ave is a home located in Ashland County with nearby schools including Ashland High School, Ashland County Community Academy, and St. Edward Elementary School.
Ownership History
Date
Name
Owned For
Owner Type
Purchase Details
Closed on
May 10, 2024
Sold by
Coning Tina P and Huff Tina P
Bought by
Huff Randy L and Huff Tina P
Current Estimated Value
Purchase Details
Closed on
May 31, 2011
Sold by
Meier Ronald A
Bought by
Coning Tina P
Home Financials for this Owner
Home Financials are based on the most recent Mortgage that was taken out on this home.
Original Mortgage
$56,400
Interest Rate
4.96%
Mortgage Type
New Conventional
Purchase Details
Closed on
Dec 31, 2009
Bought by
Meier Ronald A
Purchase Details
Closed on
Nov 24, 2009
Sold by
Thomas Wayne H
Purchase Details
Closed on
Jun 6, 2007
Sold by
Bone Nicole R
Bought by
Thomas Wayne H
Purchase Details
Closed on
Sep 1, 2006
Sold by
Bone Nicole R
Bought by
Bone Nicole R
Purchase Details
Closed on
Feb 23, 2001
Sold by
Ward Jane Ann
Bought by
Bone Nicole R
Purchase Details
Closed on
Oct 4, 1984
Bought by
Ward Jane Ann
Create a Home Valuation Report for This Property
The Home Valuation Report is an in-depth analysis detailing your home's value as well as a comparison with similar homes in the area
Home Values in the Area
Average Home Value in this Area
Purchase History
| Date | Buyer | Sale Price | Title Company |
|---|---|---|---|
| Huff Randy L | -- | None Listed On Document | |
| Coning Tina P | $70,500 | -- | |
| Meier Ronald A | $60,000 | -- | |
| -- | $59,300 | -- | |
| Thomas Wayne H | $112,000 | -- | |
| Bone Nicole R | -- | -- | |
| Bone Nicole R | $78,500 | -- | |
| Ward Jane Ann | $47,500 | -- |
Source: Public Records
Mortgage History
| Date | Status | Borrower | Loan Amount |
|---|---|---|---|
| Previous Owner | Coning Tina P | $56,400 |
Source: Public Records
Tax History Compared to Growth
Tax History
| Year | Tax Paid | Tax Assessment Tax Assessment Total Assessment is a certain percentage of the fair market value that is determined by local assessors to be the total taxable value of land and additions on the property. | Land | Improvement |
|---|---|---|---|---|
| 2024 | $1,402 | $40,600 | $5,550 | $35,050 |
| 2023 | $1,402 | $40,600 | $5,550 | $35,050 |
| 2022 | $1,267 | $29,010 | $3,970 | $25,040 |
| 2021 | $1,272 | $29,010 | $3,970 | $25,040 |
| 2020 | $1,204 | $29,010 | $3,970 | $25,040 |
| 2019 | $1,124 | $25,050 | $5,150 | $19,900 |
| 2018 | $1,134 | $25,050 | $5,150 | $19,900 |
| 2017 | $1,111 | $25,050 | $5,150 | $19,900 |
| 2016 | $1,111 | $23,420 | $4,820 | $18,600 |
| 2015 | $1,101 | $23,420 | $4,820 | $18,600 |
| 2013 | $1,447 | $30,320 | $4,800 | $25,520 |
Source: Public Records
Map
Nearby Homes