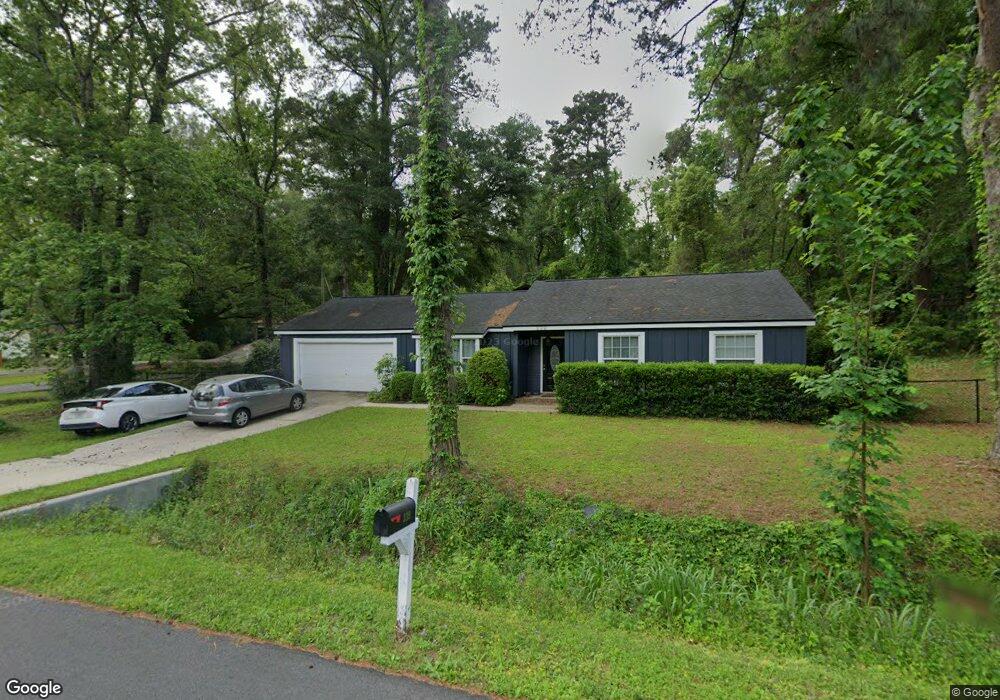
339 Lexington Rd Unit 3 Tallahassee, FL 32312
Lake Jackson NeighborhoodEstimated Value: $292,000 - $331,000
3
Beds
2
Baths
1,436
Sq Ft
$216/Sq Ft
Est. Value
About This Home
This home is located at 339 Lexington Rd Unit 3, Tallahassee, FL 32312 and is currently estimated at $309,650, approximately $215 per square foot. 339 Lexington Rd Unit 3 is a home located in Leon County with nearby schools including Sealey Elementary School, Augusta Raa Middle School, and Leon High School.
Ownership History
Date
Name
Owned For
Owner Type
Purchase Details
Closed on
Sep 25, 2015
Sold by
S&H Restorations Llc
Bought by
Langley Sarah E
Current Estimated Value
Home Financials for this Owner
Home Financials are based on the most recent Mortgage that was taken out on this home.
Original Mortgage
$135,200
Outstanding Balance
$106,698
Interest Rate
3.97%
Mortgage Type
New Conventional
Estimated Equity
$202,952
Purchase Details
Closed on
Mar 16, 2015
Sold by
Wells Fargo Bank Na
Bought by
S&H Restorations Llc
Purchase Details
Closed on
Jan 22, 2014
Sold by
Dugan Sean T
Bought by
Wells Fargo Bank Na
Purchase Details
Closed on
Mar 17, 2006
Sold by
Khoen Jennie L
Bought by
Dugan Sean T
Home Financials for this Owner
Home Financials are based on the most recent Mortgage that was taken out on this home.
Original Mortgage
$177,025
Interest Rate
6.19%
Mortgage Type
Fannie Mae Freddie Mac
Purchase Details
Closed on
Dec 12, 2003
Sold by
Jones Donna Standish and Jones Robert Gregory
Bought by
Khoen Jennie L
Home Financials for this Owner
Home Financials are based on the most recent Mortgage that was taken out on this home.
Original Mortgage
$136,900
Interest Rate
5.98%
Create a Home Valuation Report for This Property
The Home Valuation Report is an in-depth analysis detailing your home's value as well as a comparison with similar homes in the area
Home Values in the Area
Average Home Value in this Area
Purchase History
| Date | Buyer | Sale Price | Title Company |
|---|---|---|---|
| Langley Sarah E | $169,000 | Attorney | |
| S&H Restorations Llc | $89,800 | Attorney | |
| Wells Fargo Bank Na | -- | Attorney | |
| Dugan Sean T | $182,500 | Attorney | |
| Khoen Jennie L | $136,900 | -- |
Source: Public Records
Mortgage History
| Date | Status | Borrower | Loan Amount |
|---|---|---|---|
| Open | Langley Sarah E | $135,200 | |
| Previous Owner | Dugan Sean T | $177,025 | |
| Previous Owner | Khoen Jennie L | $136,900 |
Source: Public Records
Tax History Compared to Growth
Tax History
| Year | Tax Paid | Tax Assessment Tax Assessment Total Assessment is a certain percentage of the fair market value that is determined by local assessors to be the total taxable value of land and additions on the property. | Land | Improvement |
|---|---|---|---|---|
| 2024 | $1,826 | $155,738 | -- | -- |
| 2023 | $1,769 | $151,202 | $0 | $0 |
| 2022 | $1,683 | $146,798 | $0 | $0 |
| 2021 | $1,669 | $142,522 | $0 | $0 |
| 2020 | $1,615 | $140,554 | $0 | $0 |
| 2019 | $1,591 | $137,394 | $0 | $0 |
| 2018 | $1,572 | $134,832 | $0 | $0 |
| 2017 | $1,555 | $132,059 | $0 | $0 |
| 2016 | $1,542 | $129,343 | $0 | $0 |
| 2015 | $2,021 | $125,922 | $0 | $0 |
| 2014 | $2,021 | $116,773 | $0 | $0 |
Source: Public Records
Map
Nearby Homes
- 237 Sturgeon Dr
- 3306 Lemoyne Ct
- 240 Sturgeon Dr
- 3411 Deer Lane Dr
- 246 Intrepid Ct
- 3204 Remington Run
- 3513 Deer Lane Dr
- 296 Bermuda Rd
- 3481 Lakeshore Dr
- 3085 Diddie Rd
- 3508 Trillium Ct
- 407 Locksley Ln
- 2890 Green Forest Ln
- 552 High Oaks Ct
- 0 Thomas Rd Unit 379105
- 3025 Grady Rd
- 134 Meadow Wood Ct
- 0 Anton Dr
- 3429 Lakeshore Dr
- 2914 Pound Dr
- 339 Lexington Rd
- 3204 Nautilus Cir
- 3201 Triton Cir
- 340 Lexington Rd
- 3205 Triton Cir
- 3206 Nautilus Cir Unit ~
- 3206 Nautilus Cir Unit 3
- 336 Lexington Rd Unit 3
- 336 Lexington Rd
- 344 Lexington Rd Unit 3
- 344 Lexington Rd
- 3209 Triton Cir
- 332 Lexington Rd
- Lot E4 Lexington Rd
- 5185 Lexington Rd
- 3205 Nautilus Cir
- 3209 Nautilus Cir
- 348 Lexington Rd
- 328 Lexington Rd
- 3200 Triton Cir Unit 3