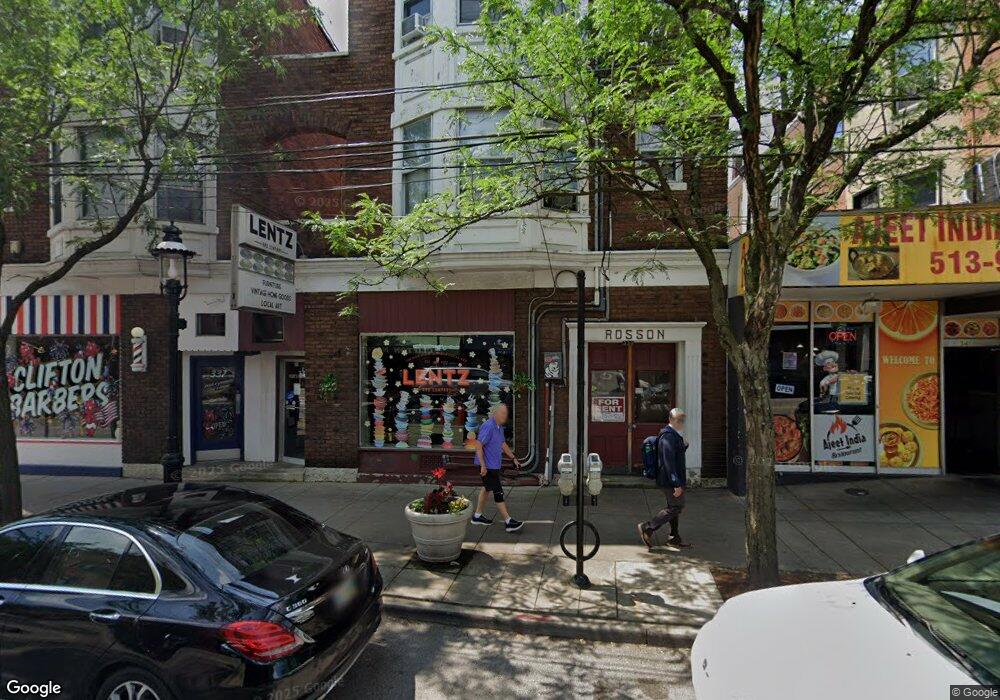
339 Ludlow Ave Cincinnati, OH 45220
Clifton NeighborhoodEstimated Value: $1,373,151
--
Bed
--
Bath
14,230
Sq Ft
$96/Sq Ft
Est. Value
About This Home
This home is located at 339 Ludlow Ave, Cincinnati, OH 45220 and is currently estimated at $1,373,151, approximately $96 per square foot. 339 Ludlow Ave is a home located in Hamilton County with nearby schools including Clifton Area Neighborhood School, Robert A. Taft Information Technology High School, and Gilbert A. Dater High School.
Ownership History
Date
Name
Owned For
Owner Type
Purchase Details
Closed on
Dec 9, 2021
Sold by
Cornell Ludlow Apartments Llc
Bought by
Emming Clifton Apartments Llc
Current Estimated Value
Purchase Details
Closed on
Aug 24, 2006
Sold by
Ritchie Raymond E and Ritchie Joan R
Bought by
Cornell Ludlow Apartments Llc
Home Financials for this Owner
Home Financials are based on the most recent Mortgage that was taken out on this home.
Original Mortgage
$700,000
Interest Rate
6.78%
Mortgage Type
Commercial
Purchase Details
Closed on
Aug 16, 1996
Sold by
Miller William E and Miller Janice L
Bought by
Ritchie Raymond E and Ritchie Joan R
Home Financials for this Owner
Home Financials are based on the most recent Mortgage that was taken out on this home.
Original Mortgage
$350,000
Interest Rate
8.18%
Mortgage Type
Commercial
Create a Home Valuation Report for This Property
The Home Valuation Report is an in-depth analysis detailing your home's value as well as a comparison with similar homes in the area
Home Values in the Area
Average Home Value in this Area
Purchase History
| Date | Buyer | Sale Price | Title Company |
|---|---|---|---|
| Emming Clifton Apartments Llc | -- | None Available | |
| Cornell Ludlow Apartments Llc | -- | None Available | |
| Ritchie Raymond E | $350,000 | -- | |
| Miller William E | -- | -- |
Source: Public Records
Mortgage History
| Date | Status | Borrower | Loan Amount |
|---|---|---|---|
| Previous Owner | Cornell Ludlow Apartments Llc | $700,000 | |
| Previous Owner | Ritchie Raymond E | $350,000 |
Source: Public Records
Tax History Compared to Growth
Tax History
| Year | Tax Paid | Tax Assessment Tax Assessment Total Assessment is a certain percentage of the fair market value that is determined by local assessors to be the total taxable value of land and additions on the property. | Land | Improvement |
|---|---|---|---|---|
| 2024 | $15,180 | $184,289 | $29,974 | $154,315 |
| 2023 | $15,142 | $184,289 | $29,974 | $154,315 |
| 2022 | $16,000 | $174,840 | $28,753 | $146,087 |
| 2021 | $15,570 | $174,840 | $28,753 | $146,087 |
| 2020 | $15,587 | $174,840 | $28,753 | $146,087 |
| 2019 | $13,504 | $139,871 | $23,002 | $116,869 |
| 2018 | $13,586 | $139,871 | $23,002 | $116,869 |
| 2017 | $13,161 | $139,871 | $23,002 | $116,869 |
| 2016 | $13,009 | $135,465 | $21,410 | $114,055 |
| 2015 | $11,959 | $135,465 | $21,410 | $114,055 |
| 2014 | $11,999 | $135,465 | $21,410 | $114,055 |
| 2013 | $12,277 | $138,229 | $21,847 | $116,382 |
Source: Public Records
Map
Nearby Homes
- 3507 Clifton Ave
- 241 Senator Place
- 2899 Maisel Dr
- 3540 Clifton Ave
- 521 Martin Luther King Dr W
- 590 Terrace Ave
- 6 Hedgerow Ln
- 3308 Morrison Ave
- 3315 Jefferson Ave
- 3476 Morrison Place
- 3280 Jefferson Ave
- 587 Martin Luther King Dr W
- 3541 Vinecrest Place
- 3035 Marshall Ave
- 3552 Vine St
- 3011 Riddle View Ln
- 3157 Bishop St
- 522 Riddle Rd
- 3202 Bishop St
- 3153 Bishop St
- 343 Ludlow Ave
- 329 Ludlow Ave
- 3400 Ormond Ave
- 325 Ludlow Ave
- 336 Howell Ave
- 330 Howell Ave
- 344 Howell Ave
- 332 Ludlow Ave
- 332 Ludlow Ave
- 3408 Telford St
- 350 Howell Ave
- 352 Howell Ave
- 3415 Telford St Unit FF
- 3415 Telford St
- 3318 Ormond Ave
- 356 Howell Ave
- 312 Ludlow Ave
- 358 Howell Ave
- 305 Ludlow Ave
- 3314 Ormond Ave