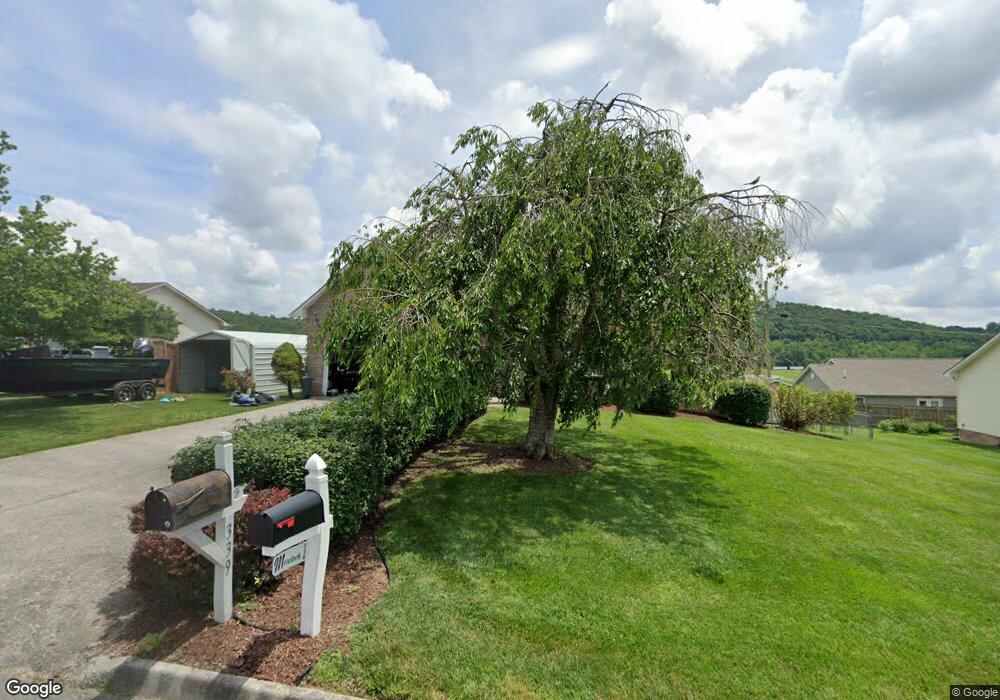
339 Mallory Dr New Tazewell, TN 37825
Estimated Value: $235,891 - $271,000
--
Bed
2
Baths
1,400
Sq Ft
$180/Sq Ft
Est. Value
About This Home
This home is located at 339 Mallory Dr, New Tazewell, TN 37825 and is currently estimated at $251,473, approximately $179 per square foot. 339 Mallory Dr is a home located in Claiborne County with nearby schools including Heriage Christian Academy.
Ownership History
Date
Name
Owned For
Owner Type
Purchase Details
Closed on
Oct 11, 2016
Sold by
Stamper Joseph and Stamper Sharon G
Bought by
Stamper Joseph and Stamper Sharon G
Current Estimated Value
Purchase Details
Closed on
Nov 25, 2013
Sold by
Ledford Sharon G
Bought by
Stamper Joseph and Ledford Sharon G
Purchase Details
Closed on
Aug 11, 2010
Sold by
Stamper Joseph
Bought by
Stamper Sharon
Purchase Details
Closed on
Jan 26, 2005
Sold by
Ledford Sharon
Bought by
Stamper Joseph
Home Financials for this Owner
Home Financials are based on the most recent Mortgage that was taken out on this home.
Original Mortgage
$106,000
Interest Rate
5.72%
Purchase Details
Closed on
Dec 17, 1998
Bought by
Ledford Jimmy D and Ledford Sharon
Purchase Details
Closed on
Mar 20, 1998
Bought by
Ball Roger A
Purchase Details
Closed on
Apr 3, 1989
Bought by
Ball Roger A and Neely James C
Create a Home Valuation Report for This Property
The Home Valuation Report is an in-depth analysis detailing your home's value as well as a comparison with similar homes in the area
Home Values in the Area
Average Home Value in this Area
Purchase History
| Date | Buyer | Sale Price | Title Company |
|---|---|---|---|
| Stamper Joseph | -- | -- | |
| Stamper Joseph | -- | -- | |
| Stamper Sharon | -- | -- | |
| Stamper Joseph | -- | -- | |
| Ledford Jimmy D | $94,000 | -- | |
| Ball Roger A | $10,000 | -- | |
| Ball Roger A | -- | -- |
Source: Public Records
Mortgage History
| Date | Status | Borrower | Loan Amount |
|---|---|---|---|
| Previous Owner | Ball Roger A | $106,000 |
Source: Public Records
Tax History Compared to Growth
Tax History
| Year | Tax Paid | Tax Assessment Tax Assessment Total Assessment is a certain percentage of the fair market value that is determined by local assessors to be the total taxable value of land and additions on the property. | Land | Improvement |
|---|---|---|---|---|
| 2024 | $925 | $39,550 | $2,900 | $36,650 |
| 2023 | $925 | $39,550 | $2,900 | $36,650 |
| 2022 | $791 | $39,550 | $2,900 | $36,650 |
| 2021 | $758 | $29,400 | $2,050 | $27,350 |
| 2020 | $758 | $29,400 | $2,050 | $27,350 |
| 2019 | $758 | $29,400 | $2,050 | $27,350 |
| 2018 | $758 | $29,400 | $2,050 | $27,350 |
| 2017 | $758 | $29,400 | $2,050 | $27,350 |
| 2016 | $775 | $30,025 | $2,050 | $27,975 |
| 2015 | $745 | $30,025 | $2,050 | $27,975 |
| 2014 | $745 | $30,005 | $0 | $0 |
Source: Public Records
Map
Nearby Homes