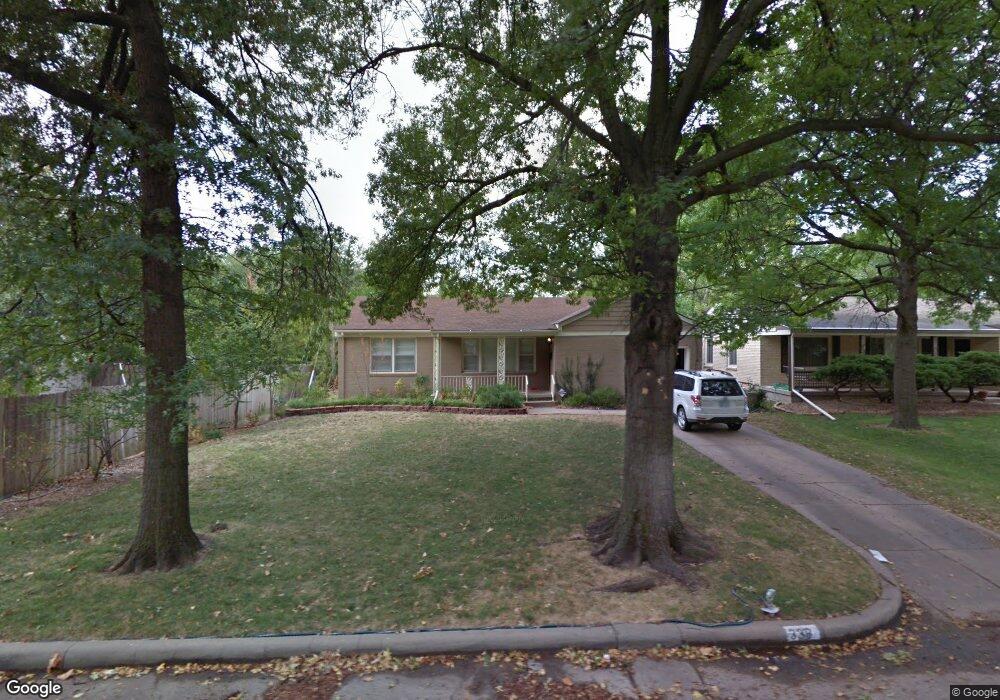
339 N Hillcrest St Wichita, KS 67208
Courtland NeighborhoodEstimated Value: $214,568 - $244,000
2
Beds
2
Baths
1,669
Sq Ft
$137/Sq Ft
Est. Value
About This Home
This home is located at 339 N Hillcrest St, Wichita, KS 67208 and is currently estimated at $229,284, approximately $137 per square foot. 339 N Hillcrest St is a home located in Sedgwick County with nearby schools including Hyde Leadership and International Exploration Magnet Elementary, Robinson Middle School, and Wichita High School East.
Ownership History
Date
Name
Owned For
Owner Type
Purchase Details
Closed on
Jun 6, 2024
Sold by
Brown Cody L and Brown Madison C
Bought by
Lebeda Connor and Sauer Anna R
Current Estimated Value
Home Financials for this Owner
Home Financials are based on the most recent Mortgage that was taken out on this home.
Original Mortgage
$189,150
Outstanding Balance
$186,805
Interest Rate
7.17%
Mortgage Type
New Conventional
Estimated Equity
$42,479
Purchase Details
Closed on
May 8, 2020
Sold by
Stephens Stewart A and Stephens Mary S
Bought by
Brown Cody L and Brown Madison C
Home Financials for this Owner
Home Financials are based on the most recent Mortgage that was taken out on this home.
Original Mortgage
$98,800
Interest Rate
3.5%
Mortgage Type
New Conventional
Purchase Details
Closed on
May 26, 2017
Sold by
Storey Allison N and Storey Andrew
Bought by
Stephens Stewart A and Stephens Mary S
Purchase Details
Closed on
Jun 24, 2011
Sold by
Raymer Kevin K and Raymer Katharine A
Bought by
Howell Allison N
Create a Home Valuation Report for This Property
The Home Valuation Report is an in-depth analysis detailing your home's value as well as a comparison with similar homes in the area
Home Values in the Area
Average Home Value in this Area
Purchase History
| Date | Buyer | Sale Price | Title Company |
|---|---|---|---|
| Lebeda Connor | -- | Security 1St Title | |
| Brown Cody L | -- | Security 1St Title Llc | |
| Stephens Stewart A | -- | Security 1St Title | |
| Howell Allison N | -- | Security 1St Title |
Source: Public Records
Mortgage History
| Date | Status | Borrower | Loan Amount |
|---|---|---|---|
| Open | Lebeda Connor | $189,150 | |
| Previous Owner | Brown Cody L | $98,800 |
Source: Public Records
Tax History Compared to Growth
Tax History
| Year | Tax Paid | Tax Assessment Tax Assessment Total Assessment is a certain percentage of the fair market value that is determined by local assessors to be the total taxable value of land and additions on the property. | Land | Improvement |
|---|---|---|---|---|
| 2025 | $1,793 | $21,103 | $3,519 | $17,584 |
| 2023 | $1,793 | $17,135 | $2,737 | $14,398 |
| 2022 | $1,602 | $14,640 | $2,576 | $12,064 |
| 2021 | $1,662 | $14,640 | $2,116 | $12,524 |
| 2020 | $1,618 | $14,203 | $2,116 | $12,087 |
| 2019 | $1,430 | $12,570 | $2,243 | $10,327 |
| 2018 | $1,331 | $11,696 | $1,760 | $9,936 |
| 2017 | $1,332 | $0 | $0 | $0 |
| 2016 | $1,289 | $0 | $0 | $0 |
| 2015 | -- | $0 | $0 | $0 |
| 2014 | -- | $0 | $0 | $0 |
Source: Public Records
Map
Nearby Homes
- 335 N Hillcrest St
- 6018 Avalon St
- 341 N Colonial Place
- 6607 E Rockwood Rd
- 408 N Saint James St
- 245 N Brookside St
- 222 N Brookside St
- 0 S Woodlawn Blvd
- 6412 E Claytonia St
- 437 N Mission Rd
- 641 N Woodlawn St #55
- 641 N Woodlawn St
- 120 S Morningside St
- 6214 Marjorie St
- 606 N Mission Rd
- 7077 E Central Ave
- 337 N Parkwood Ln
- 206 S Brookside St
- 6308 E Jacqueline St
- 6102 Jacqueline St
- 339 N Hillcrest Ave
- 345 N Hillcrest St
- 6126 Rockwood Rd
- 6132 Rockwood Rd
- 6132 E Rockwood Rd
- 351 N Hillcrest St
- 6120 Rockwood Rd
- 344 N Hillcrest St
- 6041 Avalon Ct
- 338 N Hillcrest St
- 332 N Hillcrest St
- 350 N Hillcrest Ave
- 357 N Hillcrest St
- 350 N Hillcrest St
- 6114 Rockwood Rd
- 6114 E Rockwood Rd
- 6047 Avalon Ct
- 356 N Hillcrest St
- 326 N Hillcrest St
- 363 N Hillcrest St