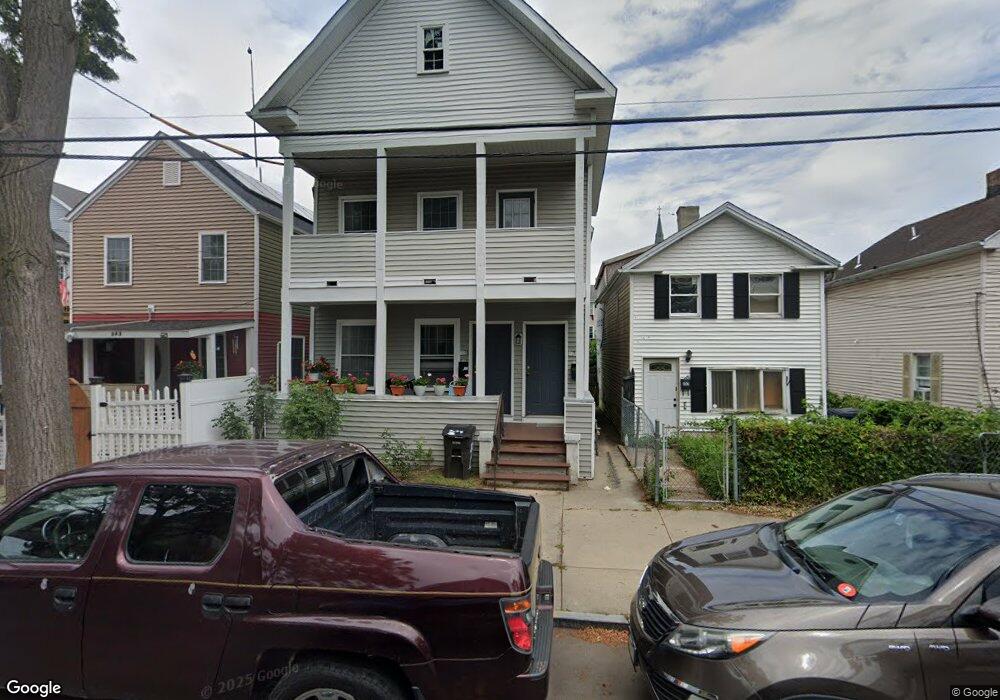
339 Poplar St New Haven, CT 06513
Fair Haven NeighborhoodEstimated Value: $277,915 - $334,000
4
Beds
3
Baths
1,580
Sq Ft
$199/Sq Ft
Est. Value
About This Home
This home is located at 339 Poplar St, New Haven, CT 06513 and is currently estimated at $313,729, approximately $198 per square foot. 339 Poplar St is a home located in New Haven County with nearby schools including Clinton Avenue School, Elm City College Preparatory School, and St Francis & St Rose Of Lima School.
Ownership History
Date
Name
Owned For
Owner Type
Purchase Details
Closed on
Oct 31, 2011
Sold by
Mutual Hsng Assn S Cen
Bought by
Fair Haven Mutual Hsng
Current Estimated Value
Purchase Details
Closed on
Feb 27, 2007
Sold by
Jolin Llc
Bought by
Mutual Housing Conn In
Purchase Details
Closed on
Jul 9, 2002
Sold by
Fin Grp Llc
Bought by
Lam Ngan Yung
Purchase Details
Closed on
Dec 27, 2001
Sold by
Us Bk Na
Bought by
Fin Kenneth
Purchase Details
Closed on
Oct 3, 1994
Sold by
Canosa Beatrice
Bought by
Hammond Lois
Create a Home Valuation Report for This Property
The Home Valuation Report is an in-depth analysis detailing your home's value as well as a comparison with similar homes in the area
Home Values in the Area
Average Home Value in this Area
Purchase History
| Date | Buyer | Sale Price | Title Company |
|---|---|---|---|
| Fair Haven Mutual Hsng | -- | -- | |
| Mutual Housing Conn In | $175,000 | -- | |
| Lam Ngan Yung | $110,000 | -- | |
| Fin Kenneth | $24,150 | -- | |
| Hammond Lois | $22,000 | -- |
Source: Public Records
Mortgage History
| Date | Status | Borrower | Loan Amount |
|---|---|---|---|
| Open | Hammond Lois | $700,000 | |
| Previous Owner | Hammond Lois | $136,000 |
Source: Public Records
Tax History Compared to Growth
Tax History
| Year | Tax Paid | Tax Assessment Tax Assessment Total Assessment is a certain percentage of the fair market value that is determined by local assessors to be the total taxable value of land and additions on the property. | Land | Improvement |
|---|---|---|---|---|
| 2025 | $5,516 | $140,000 | $26,180 | $113,820 |
| 2024 | $5,390 | $140,000 | $26,180 | $113,820 |
| 2023 | $5,987 | $160,930 | $26,180 | $134,750 |
| 2022 | $6,397 | $160,930 | $26,180 | $134,750 |
| 2021 | $4,742 | $108,065 | $20,930 | $87,135 |
| 2020 | $4,742 | $108,065 | $20,930 | $87,135 |
| 2019 | $4,645 | $108,065 | $20,930 | $87,135 |
| 2018 | $4,645 | $108,065 | $20,930 | $87,135 |
| 2017 | $4,422 | $114,310 | $20,930 | $93,380 |
| 2016 | $3,432 | $82,607 | $13,930 | $68,677 |
| 2015 | $3,432 | $82,607 | $13,930 | $68,677 |
| 2014 | $3,862 | $92,960 | $13,930 | $79,030 |
Source: Public Records
Map
Nearby Homes