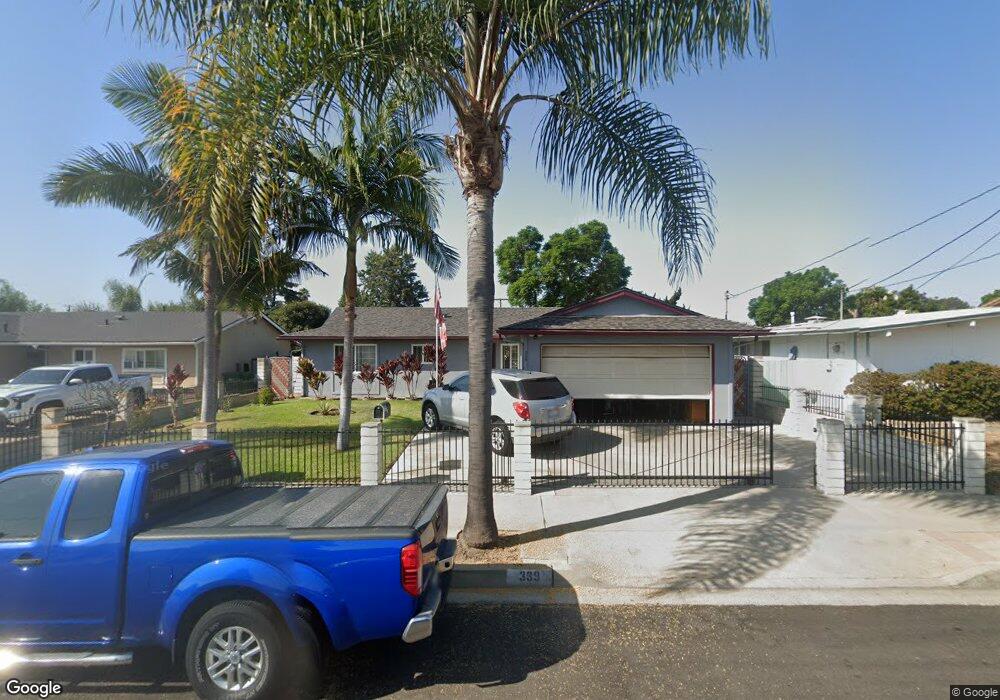
339 Redondo Dr Oceanside, CA 92057
North Valley NeighborhoodEstimated Value: $726,000 - $777,000
3
Beds
2
Baths
1,488
Sq Ft
$508/Sq Ft
Est. Value
About This Home
This home is located at 339 Redondo Dr, Oceanside, CA 92057 and is currently estimated at $756,034, approximately $508 per square foot. 339 Redondo Dr is a home located in San Diego County with nearby schools including Libby Elementary School, Cesar Chavez Middle School, and El Camino High School.
Ownership History
Date
Name
Owned For
Owner Type
Purchase Details
Closed on
Feb 21, 2003
Sold by
Vaifanua Paulo and Vaifanua Lila E
Bought by
Vaifanua Paulo and Vaifanua Lila
Current Estimated Value
Home Financials for this Owner
Home Financials are based on the most recent Mortgage that was taken out on this home.
Original Mortgage
$126,000
Outstanding Balance
$53,884
Interest Rate
5.93%
Estimated Equity
$702,150
Purchase Details
Closed on
May 18, 1990
Create a Home Valuation Report for This Property
The Home Valuation Report is an in-depth analysis detailing your home's value as well as a comparison with similar homes in the area
Home Values in the Area
Average Home Value in this Area
Purchase History
| Date | Buyer | Sale Price | Title Company |
|---|---|---|---|
| Vaifanua Paulo | -- | Commonwealth Land Title Co | |
| -- | $133,000 | -- |
Source: Public Records
Mortgage History
| Date | Status | Borrower | Loan Amount |
|---|---|---|---|
| Open | Vaifanua Paulo | $126,000 |
Source: Public Records
Tax History
| Year | Tax Paid | Tax Assessment Tax Assessment Total Assessment is a certain percentage of the fair market value that is determined by local assessors to be the total taxable value of land and additions on the property. | Land | Improvement |
|---|---|---|---|---|
| 2025 | $1,403 | $296,454 | $128,766 | $167,688 |
| 2024 | $1,403 | $290,642 | $126,242 | $164,400 |
| 2023 | $1,419 | $284,944 | $123,767 | $161,177 |
| 2022 | $1,485 | $279,358 | $121,341 | $158,017 |
| 2021 | $1,485 | $273,881 | $118,962 | $154,919 |
| 2020 | $1,471 | $271,074 | $117,743 | $153,331 |
| 2019 | $1,441 | $265,760 | $115,435 | $150,325 |
| 2018 | $2,869 | $260,550 | $113,172 | $147,378 |
| 2017 | $2,815 | $255,442 | $110,953 | $144,489 |
| 2016 | $2,722 | $250,434 | $108,778 | $141,656 |
| 2015 | $2,642 | $246,674 | $107,145 | $139,529 |
| 2014 | $2,540 | $241,843 | $105,047 | $136,796 |
Source: Public Records
Map
Nearby Homes
- 4832 Tacayme Dr
- 4901 Siesta Dr
- 4918 Roja Dr
- 4924 Verde Dr
- 436 W Redondo Dr
- 5074 Cascade Way Unit 102
- 517 Calle Montecito Unit 91
- 510 Calle Montecito Unit 51
- 518 Calle Montecito Unit 95
- 514 Calle Montecito Unit 78
- 514 Calle Montecito Unit 80
- 4745 Marblehead Bay Dr
- 0 N River Rd Unit NDP2507519
- 4660 N River Rd Unit 150
- 4660 N River Rd Unit 116
- 4660 N River Rd Unit 136
- 4660 N River Rd Unit 17
- 361 Point Windemere Place
- 5015 Macario Dr
- 154 Harrison St
Your Personal Tour Guide
Ask me questions while you tour the home.