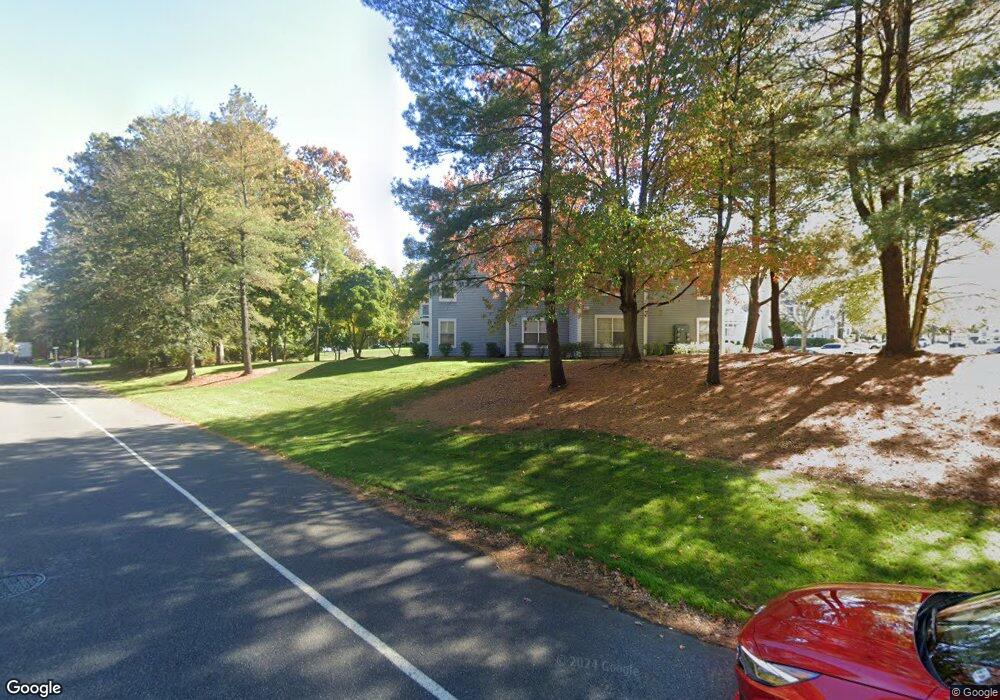
339 Sequoia Ct Howell, NJ 07731
Adelphia NeighborhoodEstimated Value: $310,000 - $347,000
2
Beds
2
Baths
1,044
Sq Ft
$312/Sq Ft
Est. Value
About This Home
This home is located at 339 Sequoia Ct, Howell, NJ 07731 and is currently estimated at $326,163, approximately $312 per square foot. 339 Sequoia Ct is a home located in Monmouth County with nearby schools including Griebling School, Howell Township Memorial Elementary School, and Howell Middle School North.
Ownership History
Date
Name
Owned For
Owner Type
Purchase Details
Closed on
Sep 16, 2005
Sold by
Lanna Paul L
Bought by
Quabeck Thomas and Quabeck Patricia
Current Estimated Value
Home Financials for this Owner
Home Financials are based on the most recent Mortgage that was taken out on this home.
Original Mortgage
$45,980
Outstanding Balance
$24,838
Interest Rate
5.81%
Mortgage Type
Credit Line Revolving
Estimated Equity
$301,325
Purchase Details
Closed on
Jun 27, 2002
Sold by
Pascale Peter
Bought by
Paul Lanna
Home Financials for this Owner
Home Financials are based on the most recent Mortgage that was taken out on this home.
Original Mortgage
$131,800
Interest Rate
6.79%
Mortgage Type
FHA
Purchase Details
Closed on
Jun 15, 1999
Sold by
Retzer Michael
Bought by
Pascale Peter and Pascale Sara
Home Financials for this Owner
Home Financials are based on the most recent Mortgage that was taken out on this home.
Original Mortgage
$75,660
Interest Rate
7.49%
Mortgage Type
FHA
Create a Home Valuation Report for This Property
The Home Valuation Report is an in-depth analysis detailing your home's value as well as a comparison with similar homes in the area
Home Values in the Area
Average Home Value in this Area
Purchase History
| Date | Buyer | Sale Price | Title Company |
|---|---|---|---|
| Quabeck Thomas | $229,900 | -- | |
| Paul Lanna | $135,900 | -- | |
| Lanna Peter | $135,900 | -- | |
| Pascale Peter | $78,000 | -- |
Source: Public Records
Mortgage History
| Date | Status | Borrower | Loan Amount |
|---|---|---|---|
| Open | Quabeck Thomas | $45,980 | |
| Open | Quabeck Thomas | $183,920 | |
| Previous Owner | Lanna Peter | $131,800 | |
| Previous Owner | Pascale Peter | $75,660 |
Source: Public Records
Tax History
| Year | Tax Paid | Tax Assessment Tax Assessment Total Assessment is a certain percentage of the fair market value that is determined by local assessors to be the total taxable value of land and additions on the property. | Land | Improvement |
|---|---|---|---|---|
| 2025 | $4,902 | $302,200 | $200,000 | $102,200 |
| 2024 | $4,631 | $280,300 | $180,000 | $100,300 |
| 2023 | $4,631 | $252,900 | $155,000 | $97,900 |
| 2022 | $4,183 | $211,600 | $110,000 | $101,600 |
| 2021 | $4,183 | $185,400 | $95,000 | $90,400 |
| 2020 | $4,208 | $184,400 | $95,000 | $89,400 |
| 2019 | $4,122 | $176,900 | $90,000 | $86,900 |
| 2018 | $3,875 | $165,400 | $82,500 | $82,900 |
| 2017 | $3,796 | $160,300 | $80,000 | $80,300 |
| 2016 | $3,712 | $154,600 | $76,300 | $78,300 |
| 2015 | $3,551 | $146,300 | $70,000 | $76,300 |
| 2014 | $3,337 | $126,700 | $61,100 | $65,600 |
Source: Public Records
Map
Nearby Homes
- 1 White Oak Ct
- 84 Briarwood Ct
- 402 Brookview Ct
- 432 Winterberry Ct
- 1 Breakwater Square
- 7 Farragut Square
- 35 Sloop Square
- 156 Pinetree Ct Unit 156
- 174 Pinetree Ct
- 63 Mariners Cove
- 259 Chickadee Ct Unit 1000
- 161a Parkway Dr Unit A
- 14 Ravenwood Ct
- 221 Chickadee Ct
- 82A Parkway Dr Unit B
- 16 Longbrook Ln
- 80 Parkway Dr Unit D
- 93 Halls Croft Rd Unit B
- 93 Halls Croft Rd Unit D
- 93 Halls Croft Rd Unit C
- 340 Sequoia Ct
- 338 Sequoia Ct Unit 338
- 337 Sequoia Ct
- 344 Sequoia Ct
- 342 Sequoia Ct Unit 342
- 343 Sequoia Ct
- 341 Sequoia Ct
- 329 Sequoia Ct
- 330 Sequoia Ct
- 557 Applewood Ct
- 331 Sequoia Ct
- 332 Sequoia Ct Unit 332
- 556 Applewood Ct
- 555 Applewood Ct
- 561 Applewood Ct
- 333 Sequoia Ct Unit 333
- 554 Applewood Ct
- 335 Sequoia Ct
- 560 Applewood Ct
- 336 Sequoia Ct
Your Personal Tour Guide
Ask me questions while you tour the home.