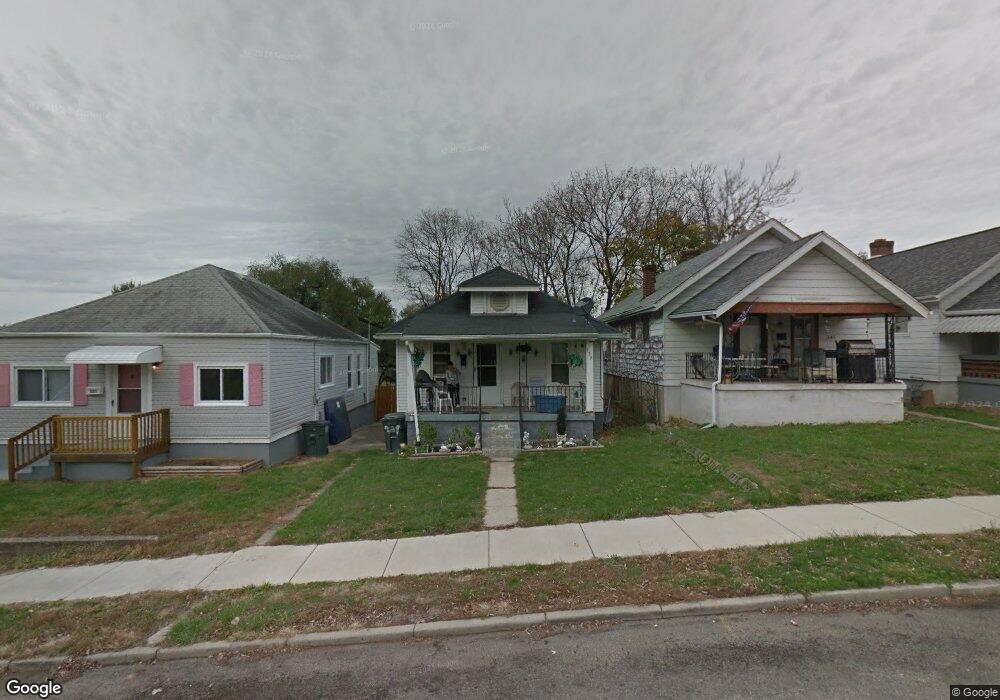
339 Sheridan Ave Dayton, OH 45403
Burkhardt NeighborhoodEstimated Value: $60,000 - $76,000
2
Beds
1
Bath
648
Sq Ft
$105/Sq Ft
Est. Value
About This Home
This home is located at 339 Sheridan Ave, Dayton, OH 45403 and is currently estimated at $68,068, approximately $105 per square foot. 339 Sheridan Ave is a home located in Montgomery County with nearby schools including Ruskin Elementary School, Kiser Elementary, and Horizon Science Academy Dayton Downtown.
Ownership History
Date
Name
Owned For
Owner Type
Purchase Details
Closed on
May 11, 2023
Sold by
Ellerthorpe Dalton Cory
Bought by
Waker Ron
Current Estimated Value
Purchase Details
Closed on
Feb 11, 2021
Sold by
Mark Jesse Jarue
Bought by
Ellerthorpe Dalton Cory
Purchase Details
Closed on
Jan 21, 2013
Sold by
Mark Jesse Jarue
Bought by
Jesse J Mark Jr At 4505 Lansmore Llc
Purchase Details
Closed on
Dec 20, 2004
Sold by
Wells Fargo Bank Minnesota Na
Bought by
Mark Jesse Jarue
Purchase Details
Closed on
Aug 16, 2001
Sold by
Johnson James R
Bought by
Hawthorne Nathaniel
Home Financials for this Owner
Home Financials are based on the most recent Mortgage that was taken out on this home.
Original Mortgage
$34,000
Interest Rate
11.25%
Create a Home Valuation Report for This Property
The Home Valuation Report is an in-depth analysis detailing your home's value as well as a comparison with similar homes in the area
Home Values in the Area
Average Home Value in this Area
Purchase History
| Date | Buyer | Sale Price | Title Company |
|---|---|---|---|
| Waker Ron | $22,000 | None Listed On Document | |
| Ellerthorpe Dalton Cory | $12,000 | None Available | |
| Jesse J Mark Jr At 4505 Lansmore Llc | -- | None Available | |
| Mark Jesse Jarue | $10,000 | Accutitle Agency Inc | |
| Hawthorne Nathaniel | $40,000 | Republic Title Agency Inc |
Source: Public Records
Mortgage History
| Date | Status | Borrower | Loan Amount |
|---|---|---|---|
| Previous Owner | Hawthorne Nathaniel | $34,000 |
Source: Public Records
Tax History Compared to Growth
Tax History
| Year | Tax Paid | Tax Assessment Tax Assessment Total Assessment is a certain percentage of the fair market value that is determined by local assessors to be the total taxable value of land and additions on the property. | Land | Improvement |
|---|---|---|---|---|
| 2024 | $423 | $7,220 | $1,650 | $5,570 |
| 2023 | $423 | $7,220 | $1,650 | $5,570 |
| 2022 | $475 | $6,310 | $1,440 | $4,870 |
| 2021 | $473 | $6,310 | $1,440 | $4,870 |
| 2020 | $484 | $6,310 | $1,440 | $4,870 |
| 2019 | $479 | $5,540 | $1,440 | $4,100 |
| 2018 | $480 | $5,540 | $1,440 | $4,100 |
| 2017 | $476 | $5,540 | $1,440 | $4,100 |
| 2016 | $519 | $5,780 | $1,440 | $4,340 |
| 2015 | $492 | $5,780 | $1,440 | $4,340 |
| 2014 | $492 | $5,780 | $1,440 | $4,340 |
| 2012 | -- | $10,210 | $2,760 | $7,450 |
Source: Public Records
Map
Nearby Homes
- 223 Pleasant Ave
- 161 S Harbine Ave
- 2929 E 5th St
- 153 S Hedges St
- 40 Klee Ave
- 2821 E 5th St Unit 2819
- 240 Bierce Ave
- 755 Huffman Ave
- 1323 Huffman Ave
- 111 S Hedges St
- 3007 E 4th St
- 227 Livingston Ave Unit 225
- 2103 E 4th St
- 639 Huffman Ave
- 101 S Delmar Ave
- 102 S Findlay St
- 240 S Torrence St
- 800 Linden Ave
- 115 Oaklawn Ave
- 631 Greenlawn Ave
- 343 Sheridan Ave
- 347 Sheridan Ave
- 327 Sheridan Ave
- 351 Sheridan Ave
- 323 Sheridan Ave
- 306 Burkhardt Ave
- 306 Burkhardt Ave Unit 3
- 312 Burkhardt Ave
- 300 Burkhardt Ave
- 357 Sheridan Ave
- 272 Burkhardt Ave
- 319 Sheridan Ave
- 342 Sheridan Ave
- 318 Burkhardt Ave
- 266 Burkhardt Ave
- 336 Sheridan Ave
- 354 Sheridan Ave
- 330 Sheridan Ave
- 315 Sheridan Ave
- 348 Sheridan Ave