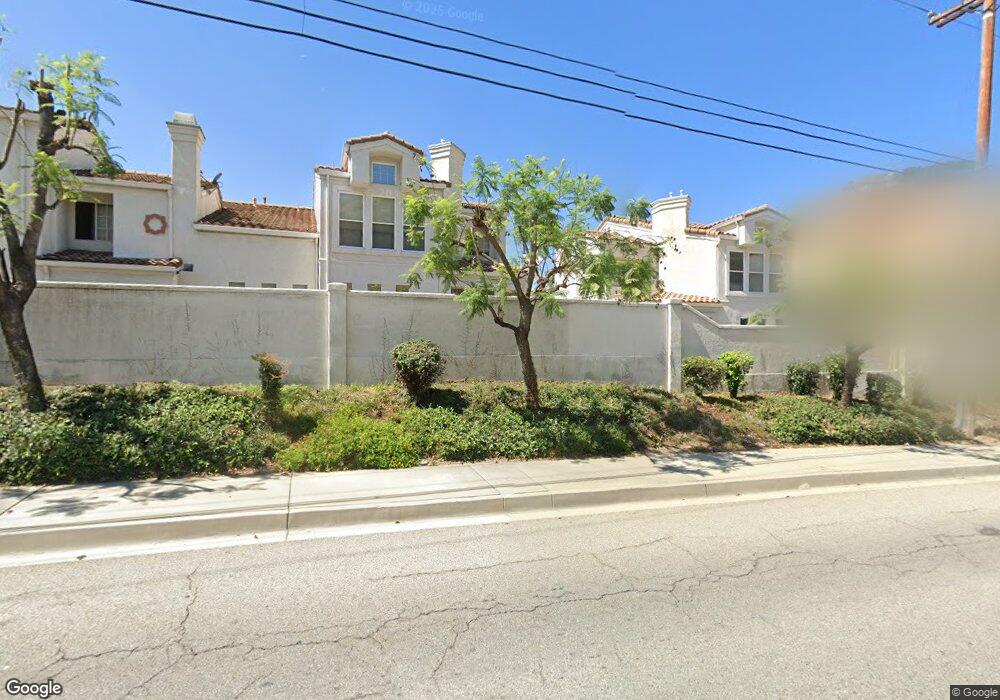
339 Via Moreno Unit 11 Pomona, CA 91766
Phillips Ranch NeighborhoodEstimated Value: $659,861 - $840,000
3
Beds
3
Baths
1,752
Sq Ft
$412/Sq Ft
Est. Value
About This Home
This home is located at 339 Via Moreno Unit 11, Pomona, CA 91766 and is currently estimated at $721,965, approximately $412 per square foot. 339 Via Moreno Unit 11 is a home located in Los Angeles County with nearby schools including Ranch Hills Elementary, Lorbeer Middle School, and Diamond Ranch High School.
Ownership History
Date
Name
Owned For
Owner Type
Purchase Details
Closed on
Dec 13, 2022
Sold by
Kim Jeanne Kangmee
Bought by
Kim Gae Trust
Current Estimated Value
Purchase Details
Closed on
Dec 16, 2014
Sold by
Kim Jeanne Kangmee and Kim Gae David
Bought by
Kim Jeanne Kangmee
Home Financials for this Owner
Home Financials are based on the most recent Mortgage that was taken out on this home.
Original Mortgage
$234,000
Interest Rate
3.96%
Mortgage Type
New Conventional
Purchase Details
Closed on
Dec 3, 2013
Sold by
Kim Tae Hyung and Jung Hyesoo
Bought by
Kim Jeanne Kangmee
Purchase Details
Closed on
Apr 22, 2013
Sold by
Kim Tae Hyung
Bought by
Kim Tae Hyung and Jung Hyesoo
Home Financials for this Owner
Home Financials are based on the most recent Mortgage that was taken out on this home.
Original Mortgage
$238,000
Interest Rate
3.54%
Mortgage Type
Purchase Money Mortgage
Purchase Details
Closed on
Sep 15, 2009
Sold by
Chen Yan
Bought by
Kim Tae Hyung
Home Financials for this Owner
Home Financials are based on the most recent Mortgage that was taken out on this home.
Original Mortgage
$248,000
Interest Rate
5.14%
Mortgage Type
New Conventional
Purchase Details
Closed on
Sep 15, 2006
Sold by
Zhang Shenghua
Bought by
Chen Yan
Home Financials for this Owner
Home Financials are based on the most recent Mortgage that was taken out on this home.
Original Mortgage
$372,000
Interest Rate
6.53%
Mortgage Type
Purchase Money Mortgage
Purchase Details
Closed on
Aug 31, 2006
Sold by
Fung Kimberly W
Bought by
Chen Yan
Home Financials for this Owner
Home Financials are based on the most recent Mortgage that was taken out on this home.
Original Mortgage
$372,000
Interest Rate
6.53%
Mortgage Type
Purchase Money Mortgage
Purchase Details
Closed on
Jan 5, 2006
Sold by
Desengano David C and Desengano Helen L
Bought by
Fung Kimberly W
Home Financials for this Owner
Home Financials are based on the most recent Mortgage that was taken out on this home.
Original Mortgage
$360,000
Interest Rate
6.28%
Mortgage Type
Fannie Mae Freddie Mac
Purchase Details
Closed on
Dec 9, 1997
Sold by
Diamond Brothers Four Ptnshp
Bought by
Desengano David C and Desengano Helen L
Home Financials for this Owner
Home Financials are based on the most recent Mortgage that was taken out on this home.
Original Mortgage
$172,800
Interest Rate
5.95%
Create a Home Valuation Report for This Property
The Home Valuation Report is an in-depth analysis detailing your home's value as well as a comparison with similar homes in the area
Home Values in the Area
Average Home Value in this Area
Purchase History
| Date | Buyer | Sale Price | Title Company |
|---|---|---|---|
| Kim Gae Trust | -- | -- | |
| Kim Jeanne Kangmee | -- | Provident Title Company | |
| Kim Jeanne Kangmee | -- | Accommodation | |
| Kim Tae Hyung | -- | None Available | |
| Kim Tae Hyung | $327,000 | Investors Title Company Gln | |
| Chen Yan | -- | Ugtic Diamond Bar | |
| Chen Yan | $465,000 | Ugtic Diamond Bar | |
| Fung Kimberly W | $450,000 | Fidelity National Title Co | |
| Desengano David C | $192,000 | Continental Lawyers Title Co |
Source: Public Records
Mortgage History
| Date | Status | Borrower | Loan Amount |
|---|---|---|---|
| Previous Owner | Kim Jeanne Kangmee | $234,000 | |
| Previous Owner | Kim Tae Hyung | $238,000 | |
| Previous Owner | Kim Tae Hyung | $248,000 | |
| Previous Owner | Chen Yan | $372,000 | |
| Previous Owner | Chen Yan | $46,450 | |
| Previous Owner | Fung Kimberly W | $360,000 | |
| Previous Owner | Desengano David C | $172,800 |
Source: Public Records
Tax History Compared to Growth
Tax History
| Year | Tax Paid | Tax Assessment Tax Assessment Total Assessment is a certain percentage of the fair market value that is determined by local assessors to be the total taxable value of land and additions on the property. | Land | Improvement |
|---|---|---|---|---|
| 2025 | $4,375 | $341,270 | $170,391 | $170,879 |
| 2024 | $4,375 | $334,579 | $167,050 | $167,529 |
| 2023 | $4,288 | $328,020 | $163,775 | $164,245 |
| 2022 | $4,221 | $321,589 | $160,564 | $161,025 |
| 2021 | $4,121 | $315,284 | $157,416 | $157,868 |
| 2019 | $4,212 | $305,935 | $152,748 | $153,187 |
| 2018 | $3,910 | $299,937 | $149,753 | $150,184 |
| 2016 | $3,664 | $288,292 | $143,939 | $144,353 |
| 2015 | $3,633 | $283,962 | $141,777 | $142,185 |
| 2014 | $3,609 | $278,400 | $139,000 | $139,400 |
Source: Public Records
Map
Nearby Homes
- 309 Via Moreno
- 3727 Legato Ct
- 3507 Legato Ct
- 1142 Flintlock Rd
- 1815 W 9th St
- 1109 Golden Springs Dr Unit G
- 55 Los Coyotes Dr
- 1798 Wright St
- 1803 Fleming St
- 2635 Valley Blvd
- 23837 Strange Creek Dr
- 24161 High Knob Rd Unit C
- 1768 Wright St
- 1175 Flying Hill Place
- 1030 Golden Springs Dr Unit B
- 16 Los Felis Dr
- 18 Calle Del Rodeo
- 1706 Grier St
- 23848 Sunset Crossing Rd
- 1693 Jess St
- 305 Via Moreno Unit 20
- 339 Via Moreno
- 376 Via Valdez
- 329 Via Moreno Unit 14
- 365 Via Moreno
- 328 Carrione Ct
- 324 Carrione Ct Unit 22
- 320 Carrione Ct
- 305 Via Moreno
- 313 Via Moreno
- 317 Via Moreno
- 321 Via Moreno
- 325 Via Moreno
- 331 Via Moreno Unit 13
- 335 Via Moreno Unit 12
- 341 Via Moreno
- 345 Via Moreno
- 351 Via Moreno
- 355 Via Moreno
- 361 Via Moreno Unit 6