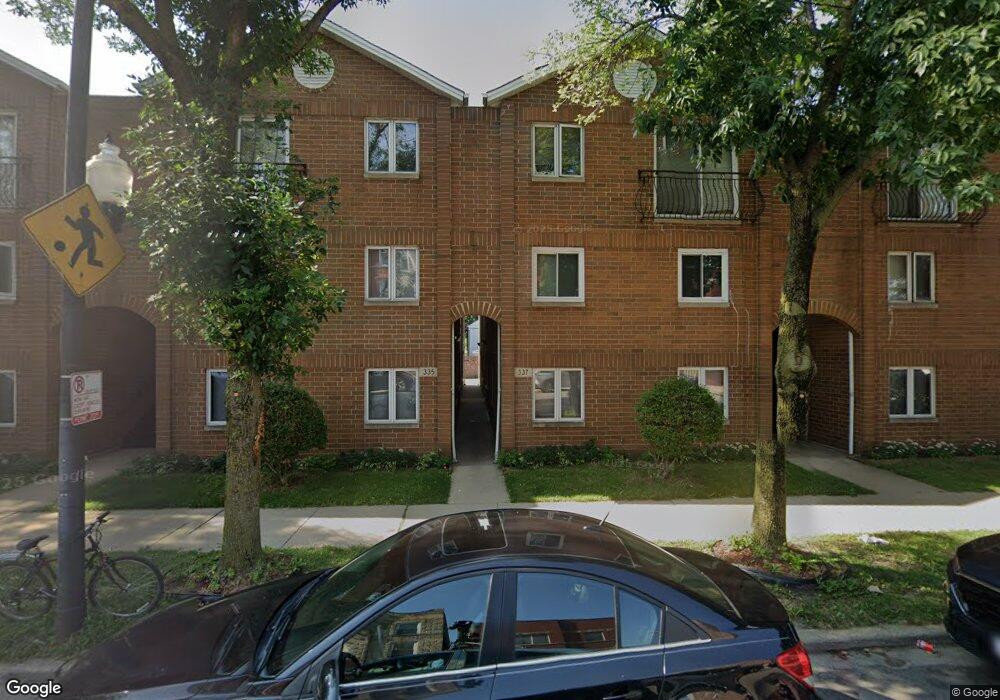
339 W 24th St Unit 3393F Chicago, IL 60616
Chinatown NeighborhoodEstimated Value: $299,000 - $364,000
--
Bed
--
Bath
--
Sq Ft
0.44
Acres
About This Home
This home is located at 339 W 24th St Unit 3393F, Chicago, IL 60616 and is currently estimated at $316,744. 339 W 24th St Unit 3393F is a home located in Cook County with nearby schools including Haines Elementary School, Wendell Phillips Academy High School, and St Therese School.
Ownership History
Date
Name
Owned For
Owner Type
Purchase Details
Closed on
Apr 22, 2009
Sold by
Zhou Li Ren and Zhou Jian Feng
Bought by
Zhou Li Ren and Zhou Jian Feng
Current Estimated Value
Purchase Details
Closed on
Mar 10, 2006
Sold by
Yee Shiu Ton and Yee Kin Chor
Bought by
Zhou Li Ren and Zhou Jian Feng
Home Financials for this Owner
Home Financials are based on the most recent Mortgage that was taken out on this home.
Original Mortgage
$170,000
Outstanding Balance
$87,964
Interest Rate
4.77%
Mortgage Type
Unknown
Estimated Equity
$228,780
Purchase Details
Closed on
Nov 5, 2002
Sold by
Yee Shiu Ton
Bought by
Yee Shiu Ton and Yee Kin Chor
Purchase Details
Closed on
Nov 3, 1997
Sold by
Lakeside Bank
Bought by
Yee Gin Sum and Yee Shiu Ton
Home Financials for this Owner
Home Financials are based on the most recent Mortgage that was taken out on this home.
Original Mortgage
$60,000
Interest Rate
7.45%
Create a Home Valuation Report for This Property
The Home Valuation Report is an in-depth analysis detailing your home's value as well as a comparison with similar homes in the area
Home Values in the Area
Average Home Value in this Area
Purchase History
| Date | Buyer | Sale Price | Title Company |
|---|---|---|---|
| Zhou Li Ren | -- | None Available | |
| Zhou Li Ren | $230,000 | Atg | |
| Yee Shiu Ton | -- | -- | |
| Yee Gin Sum | $116,000 | -- |
Source: Public Records
Mortgage History
| Date | Status | Borrower | Loan Amount |
|---|---|---|---|
| Open | Zhou Li Ren | $170,000 | |
| Previous Owner | Yee Gin Sum | $60,000 |
Source: Public Records
Tax History Compared to Growth
Tax History
| Year | Tax Paid | Tax Assessment Tax Assessment Total Assessment is a certain percentage of the fair market value that is determined by local assessors to be the total taxable value of land and additions on the property. | Land | Improvement |
|---|---|---|---|---|
| 2024 | $3,732 | $27,430 | $3,635 | $23,795 |
| 2023 | $2,081 | $23,657 | $2,934 | $20,723 |
| 2022 | $2,081 | $23,657 | $2,934 | $20,723 |
| 2021 | $1,993 | $23,656 | $2,934 | $20,722 |
| 2020 | $3,493 | $21,263 | $2,934 | $18,329 |
| 2019 | $3,073 | $21,468 | $2,934 | $18,534 |
| 2018 | $3,343 | $23,796 | $2,934 | $20,862 |
| 2017 | $2,162 | $16,976 | $2,334 | $14,642 |
| 2016 | $2,543 | $16,976 | $2,334 | $14,642 |
| 2015 | $2,456 | $17,897 | $2,334 | $15,563 |
| 2014 | $2,621 | $18,532 | $2,834 | $15,698 |
| 2013 | $2,892 | $18,532 | $2,834 | $15,698 |
Source: Public Records
Map
Nearby Homes
- 339 W 23rd Place
- 310 W 24th Place
- 235 W 23rd St
- 2310 S Canal St Unit 401
- 2310 S Canal St Unit 212
- 2241 S Archer Ave Unit 4
- 211 W 23rd St
- 2237 S Stewart Ave
- 475 W 24th St Unit 2A
- 3255 S Canal St
- 349 W 26th St
- 222 W 26th St Unit 202
- 459 W 26th St
- 2631 S Shields Ave
- 511 W 25th Place
- 2131 S Archer Ave Unit 306
- 2543 S Wallace St Unit 11
- 3246 S Wells St
- 2734 S Wentworth Ave Unit 317
- 2545 S Dearborn St Unit P-56
- 333 W 24th St Unit 3331R
- 333 W 24th St Unit 3331F
- 339 W 24th St Unit 3391R
- 333 W 24th St Unit 3332F
- 339 W 24th St Unit 3391F
- 339 W 24th St Unit 3392R
- 343 W 24th St Unit 3433
- 339 W 24th St Unit 3393R
- 333 W 24th St Unit 3333R
- 333 W 24th St Unit 3333F
- 343 W 24th St Unit 3432
- 339 W 24th St Unit 3392F
- 333 W 24th St Unit 3332R
- 343 W 24th St Unit 3431
- 343 W 24th St Unit 3
- 333 W 24th St Unit 3
- 341 W 24th St Unit 3413
- 341 W 24th St Unit 3412
- 341 W 24th St Unit 3411
- 337 W 24th St Unit 3372F