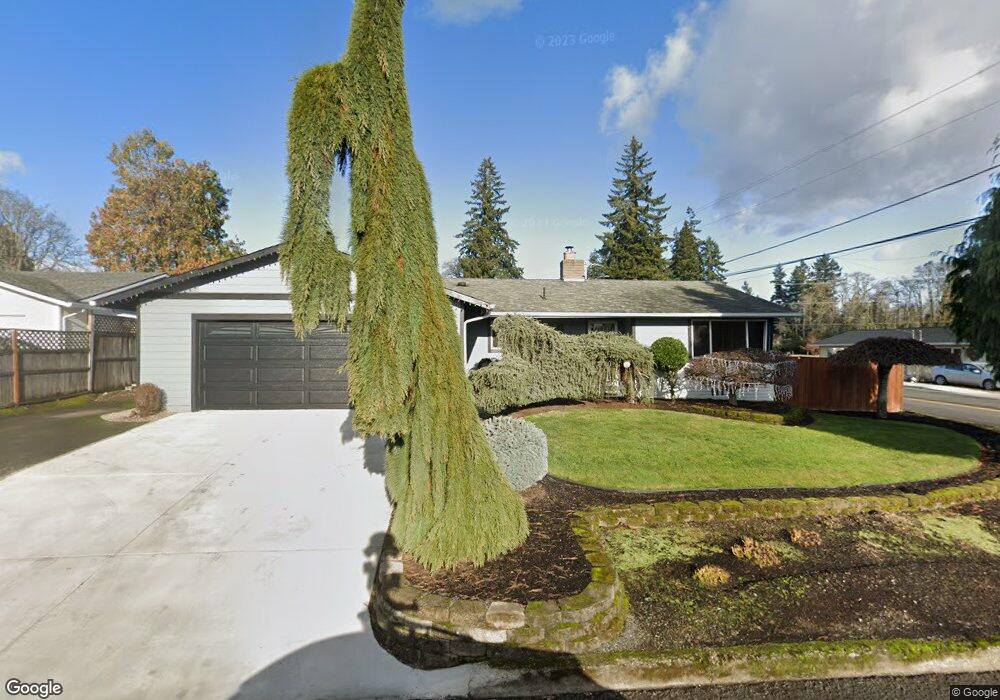
33915 SE Patricia Way Unit 1 Scappoose, OR 97056
Estimated Value: $477,125 - $523,000
3
Beds
2
Baths
1,570
Sq Ft
$324/Sq Ft
Est. Value
About This Home
This home is located at 33915 SE Patricia Way Unit 1, Scappoose, OR 97056 and is currently estimated at $508,031, approximately $323 per square foot. 33915 SE Patricia Way Unit 1 is a home located in Columbia County with nearby schools including Scappoose High School, South Columbia Family School, and Scappoose Adventist School.
Ownership History
Date
Name
Owned For
Owner Type
Purchase Details
Closed on
Oct 19, 2023
Sold by
Legler Larry A and Legler Cheryl A
Bought by
Manning Brian Edward and Manning Peggy Marie
Current Estimated Value
Home Financials for this Owner
Home Financials are based on the most recent Mortgage that was taken out on this home.
Original Mortgage
$242,500
Interest Rate
7.12%
Mortgage Type
New Conventional
Purchase Details
Closed on
May 9, 2002
Bought by
Legler Larry A and Legler Cheryl A
Create a Home Valuation Report for This Property
The Home Valuation Report is an in-depth analysis detailing your home's value as well as a comparison with similar homes in the area
Home Values in the Area
Average Home Value in this Area
Purchase History
| Date | Buyer | Sale Price | Title Company |
|---|---|---|---|
| Manning Brian Edward | $485,000 | Ticor Title | |
| Legler Larry A | $154,900 | -- |
Source: Public Records
Mortgage History
| Date | Status | Borrower | Loan Amount |
|---|---|---|---|
| Closed | Manning Brian Edward | $242,500 |
Source: Public Records
Tax History Compared to Growth
Tax History
| Year | Tax Paid | Tax Assessment Tax Assessment Total Assessment is a certain percentage of the fair market value that is determined by local assessors to be the total taxable value of land and additions on the property. | Land | Improvement |
|---|---|---|---|---|
| 2025 | $4,278 | $243,340 | $91,360 | $151,980 |
| 2024 | $4,167 | $236,260 | $88,700 | $147,560 |
| 2023 | $4,131 | $229,380 | $91,750 | $137,630 |
| 2022 | $3,972 | $222,700 | $89,080 | $133,620 |
| 2021 | $3,869 | $216,220 | $95,140 | $121,080 |
| 2020 | $3,605 | $209,930 | $89,270 | $120,660 |
| 2019 | $3,520 | $203,820 | $85,900 | $117,920 |
| 2018 | $3,471 | $197,890 | $97,180 | $100,710 |
| 2017 | $3,412 | $192,130 | $94,350 | $97,780 |
| 2016 | $3,385 | $186,540 | $91,600 | $94,940 |
| 2015 | $3,229 | $181,110 | $75,860 | $105,250 |
| 2014 | $3,132 | $175,840 | $73,950 | $101,890 |
Source: Public Records
Map
Nearby Homes
- 52171 Casswell Dr
- 52256 SE 6th Ct
- 52144 SE 8th St
- 51587 SE Oak St
- 51425 SE Oak St Unit 65
- 52269 SE Tyler St
- 52238 Teakwood Dr
- 51784 SE 9th St
- 51925 Columbia River Hwy
- 51692 SE 3rd St
- 52407 NE 14th St
- 33375 SW Rokin Way
- 33363 SW Rokin Way
- 33370 SW Rokin Way
- 33374 SW Rokin Way
- 33358 SW Rokin Way
- 33344 SW Rokin Way
- 51540 SE Westlake Dr Unit 56
- 51459 SE Westlake Dr Unit 102
- 51361 SE Hood View Dr Unit 139
- 33915 SE Patricia Way
- 33901 SE Patricia Way
- 33910 SE Elm St
- 33896 SE Elm St
- 52190 SE 6th St
- 52168 SE 6th St
- 33891 SE Patricia Way
- 33916 SE Patricia Way
- 54129 SE 6th St
- 52251 SE 6th St
- 52256 SE 6th St
- 52226 SE 6th St
- 52244 SE 6th St
- 52232 SE 6th St
- 33880 SE Elm St
- 33904 SE Patricia Way
- 33887 SE Patricia Way
- 52165 Casswell Dr
- 52226 SE Endicott Ln
- 33892 SE Patricia Way