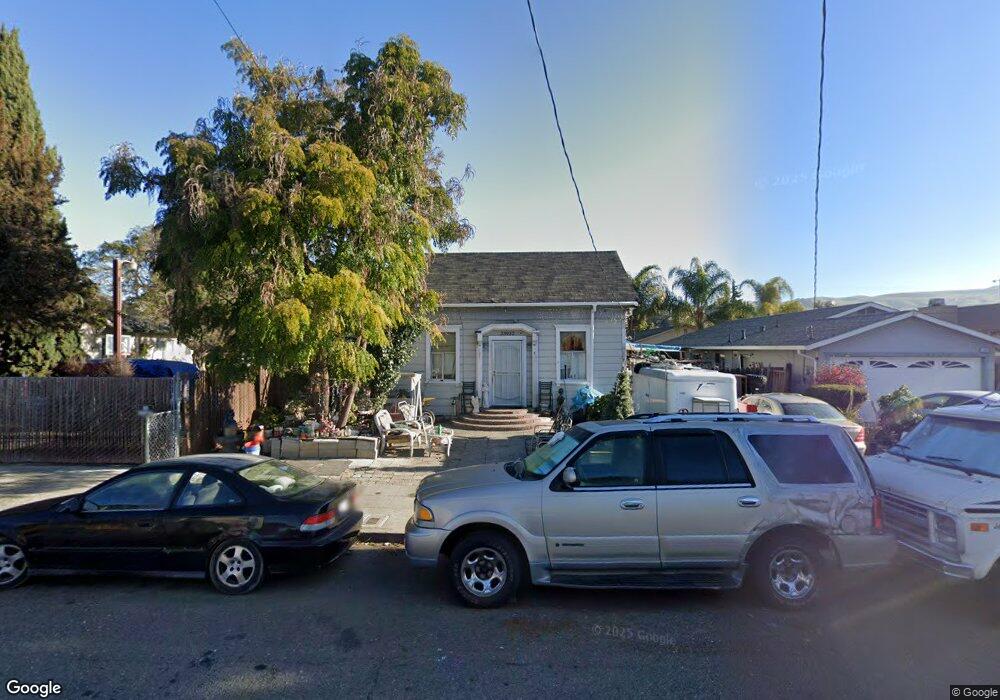
33932 10th St Union City, CA 94587
Downtown Union City NeighborhoodEstimated Value: $578,000 - $779,000
1
Bed
1
Bath
998
Sq Ft
$707/Sq Ft
Est. Value
About This Home
This home is located at 33932 10th St, Union City, CA 94587 and is currently estimated at $705,920, approximately $707 per square foot. 33932 10th St is a home located in Alameda County with nearby schools including Searles Elementary School, Cesar Chavez Middle School, and James Logan High School.
Ownership History
Date
Name
Owned For
Owner Type
Purchase Details
Closed on
Nov 8, 2016
Sold by
Hai Rene Lee Kan and De Hernandez Ramona Ornelas P
Bought by
Hal Rene Lee Kan and Dehernandez Ramona Ornelas
Current Estimated Value
Home Financials for this Owner
Home Financials are based on the most recent Mortgage that was taken out on this home.
Original Mortgage
$321,530
Outstanding Balance
$256,739
Interest Rate
3.25%
Mortgage Type
FHA
Estimated Equity
$449,181
Purchase Details
Closed on
Jul 20, 2006
Sold by
Kanhal Joseph
Bought by
Kanhal Rene
Home Financials for this Owner
Home Financials are based on the most recent Mortgage that was taken out on this home.
Original Mortgage
$320,000
Interest Rate
8.25%
Mortgage Type
Balloon
Purchase Details
Closed on
Apr 24, 2002
Sold by
Hernandez Ramona
Bought by
Hernandez Andrea and Hernandez Ramona
Home Financials for this Owner
Home Financials are based on the most recent Mortgage that was taken out on this home.
Original Mortgage
$123,000
Interest Rate
8%
Create a Home Valuation Report for This Property
The Home Valuation Report is an in-depth analysis detailing your home's value as well as a comparison with similar homes in the area
Home Values in the Area
Average Home Value in this Area
Purchase History
We collect this data history from publicly available records. To have your information removed, we recommend requesting removal directly through your county’s website.
| Date | Buyer | Sale Price | Title Company |
|---|---|---|---|
| Hal Rene Lee Kan | -- | North American Title Co Inc | |
| Kanhal Rene | -- | Alliance Title Company | |
| Hernandez Ramona | $160,000 | Alliance Title Company | |
| Hernandez Andrea | $61,500 | First American Title Guarant |
Source: Public Records
Mortgage History
We collect this data history from publicly available records. To have your information removed, we recommend requesting removal directly through your county’s website.
| Date | Status | Borrower | Loan Amount |
|---|---|---|---|
| Open | Hal Rene Lee Kan | $321,530 | |
| Closed | Hernandez Ramona | $320,000 | |
| Previous Owner | Hernandez Andrea | $123,000 |
Source: Public Records
Tax History
| Year | Tax Paid | Tax Assessment Tax Assessment Total Assessment is a certain percentage of the fair market value that is determined by local assessors to be the total taxable value of land and additions on the property. | Land | Improvement |
|---|---|---|---|---|
| 2025 | $1,969 | $29,286 | $22,556 | $13,730 |
| 2024 | $1,969 | $28,574 | $22,114 | $13,460 |
| 2023 | $1,829 | $34,876 | $21,680 | $13,196 |
| 2022 | $1,754 | $27,193 | $21,255 | $12,938 |
| 2021 | $1,712 | $26,522 | $20,838 | $12,684 |
| 2020 | $1,719 | $33,179 | $20,625 | $12,554 |
| 2019 | $1,708 | $32,528 | $20,220 | $12,308 |
| 2018 | $1,660 | $31,891 | $19,824 | $12,067 |
| 2017 | $1,615 | $31,265 | $19,435 | $11,830 |
| 2016 | $1,560 | $30,652 | $19,054 | $11,598 |
| 2015 | $1,518 | $30,192 | $18,768 | $11,424 |
| 2014 | $1,459 | $29,600 | $18,400 | $11,200 |
Source: Public Records
Map
Nearby Homes
- 33941 9th St
- 33853 10th St
- 33638 9th St
- 33721 12th St
- 221 Dutra Vernaci Dr
- 645 F St
- 33636 14th St
- 33520 Depot Rd
- 33554 7th St
- 513 F St
- 33603 3rd St
- 1013 Amber Terrace Unit 64
- 34306 Torrey Pine Ln
- 33419 5th St
- 1729 Sherman Dr
- 940 B St
- 1055 Green St Unit 314
- 146 Donoso Plaza
- 33049 Alicante Terrace Unit 67
- 34517 Windflower Ln
- 33861 Depot Rd
- 33873 Depot Rd
- 33849 Depot Rd
- 33908 Depot Rd
- 33888 Depot Rd
- 33948 Depot Rd
- 33885 Depot Rd
- 33837 Depot Rd
- 33911 9th St
- 33921 9th St
- 33931 Railroad Ave
- 33915 Railroad Ave
- 33941 Railroad Ave
- 33875 9th St
- 33905 9th St
- 33945 Railroad Ave
- 33937 9th St
- 33950 Depot Rd
- 33947 Railroad Ave
- 33867 9th St
Your Personal Tour Guide
Ask me questions while you tour the home.