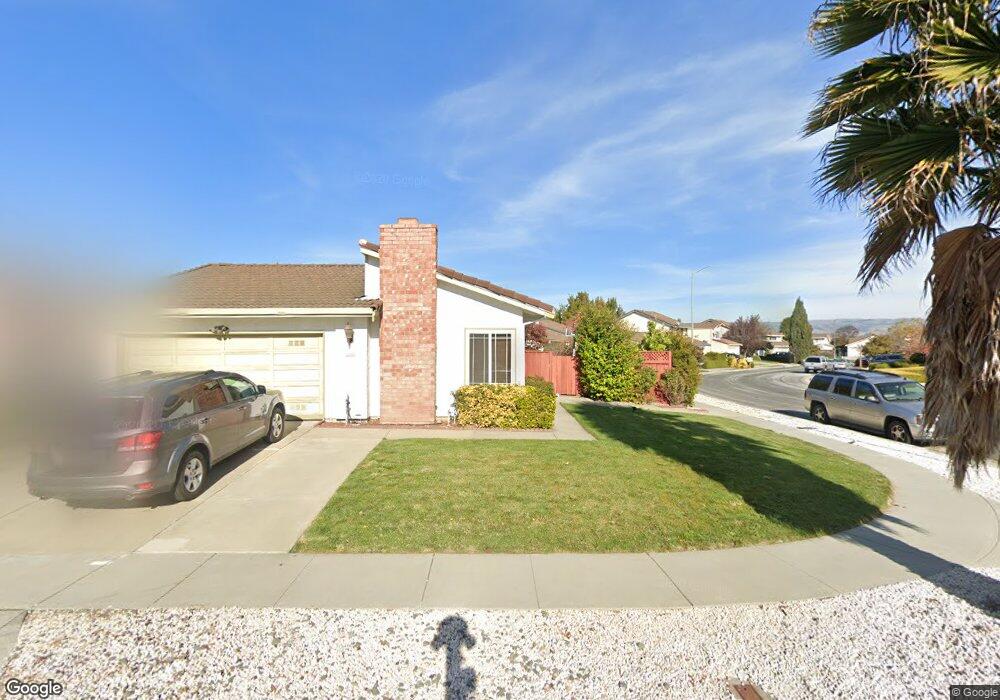
33948 Capulet Cir Fremont, CA 94555
Ardenwood NeighborhoodEstimated Value: $1,348,991 - $1,658,000
3
Beds
2
Baths
1,241
Sq Ft
$1,249/Sq Ft
Est. Value
About This Home
This home is located at 33948 Capulet Cir, Fremont, CA 94555 and is currently estimated at $1,550,498, approximately $1,249 per square foot. 33948 Capulet Cir is a home located in Alameda County with nearby schools including Ardenwood Elementary, Thornton Middle School, and American High School.
Ownership History
Date
Name
Owned For
Owner Type
Purchase Details
Closed on
Mar 11, 2020
Sold by
Sen Bikram R and Sen Bhumika
Bought by
Sen Bikram R and Sen Bhumika
Current Estimated Value
Home Financials for this Owner
Home Financials are based on the most recent Mortgage that was taken out on this home.
Original Mortgage
$319,600
Outstanding Balance
$282,512
Interest Rate
3.4%
Mortgage Type
New Conventional
Estimated Equity
$1,267,986
Purchase Details
Closed on
Aug 29, 2011
Sold by
Nguyen Nguyen Suong Kim Suong Kim and Nguyen Phi Ngoc
Bought by
Sen Bikram R and Sen Bhumika
Home Financials for this Owner
Home Financials are based on the most recent Mortgage that was taken out on this home.
Original Mortgage
$384,000
Interest Rate
3.5%
Mortgage Type
Adjustable Rate Mortgage/ARM
Purchase Details
Closed on
Jan 15, 2010
Sold by
Nguyen Phi Ngoc and Nguyen Suong Kim
Bought by
Nguyen Phi Ngoc and Nguyen Suong Kim
Purchase Details
Closed on
Dec 26, 1996
Sold by
Nguyen Qui
Bought by
Nguyen Phi Ngoc and Nguyen Suong Kim
Create a Home Valuation Report for This Property
The Home Valuation Report is an in-depth analysis detailing your home's value as well as a comparison with similar homes in the area
Home Values in the Area
Average Home Value in this Area
Purchase History
| Date | Buyer | Sale Price | Title Company |
|---|---|---|---|
| Sen Bikram R | -- | Wfg National Title Ins Co | |
| Sen Bikram R | $480,000 | Fidelity National Title Co | |
| Nguyen Phi Ngoc | -- | None Available | |
| Nguyen Phi Ngoc | -- | -- |
Source: Public Records
Mortgage History
| Date | Status | Borrower | Loan Amount |
|---|---|---|---|
| Open | Sen Bikram R | $319,600 | |
| Closed | Sen Bikram R | $384,000 |
Source: Public Records
Tax History Compared to Growth
Tax History
| Year | Tax Paid | Tax Assessment Tax Assessment Total Assessment is a certain percentage of the fair market value that is determined by local assessors to be the total taxable value of land and additions on the property. | Land | Improvement |
|---|---|---|---|---|
| 2025 | $7,554 | $606,230 | $180,862 | $425,368 |
| 2024 | $7,554 | $594,347 | $177,317 | $417,030 |
| 2023 | $7,346 | $582,695 | $173,841 | $408,854 |
| 2022 | $7,243 | $571,270 | $170,432 | $400,838 |
| 2021 | $7,033 | $556,971 | $167,091 | $389,880 |
| 2020 | $7,023 | $551,264 | $165,379 | $385,885 |
| 2019 | $6,946 | $540,460 | $162,138 | $378,322 |
| 2018 | $6,810 | $529,867 | $158,960 | $370,907 |
| 2017 | $6,641 | $519,480 | $155,844 | $363,636 |
| 2016 | $6,442 | $509,294 | $152,788 | $356,506 |
| 2015 | $6,351 | $501,647 | $150,494 | $351,153 |
| 2014 | $6,238 | $491,821 | $147,546 | $344,275 |
Source: Public Records
Map
Nearby Homes
- 5301 Shamrock Common
- 4744 Touchstone Terrace
- 34198 Tony Terrace
- 34648 Musk Terrace
- 4512 Macbeth Ave
- 5220 Fairbanks Common
- 34565 Pueblo Terrace
- 5621 Via Lugano
- 5308 Tacoma Common
- 34192 Firenze Terrace
- 33018 Soquel St
- 5176 Tacoma Common
- 34607 Pueblo Terrace
- 32945 Regents Blvd
- 34627 Pueblo Terrace
- 33064 Compton Ct
- 34102 Zaner Way
- 4141 Deep Creek Rd Unit 137
- 6004 Pisa Terrace Unit 119
- 6003 Milano Terrace Unit 14
- 33944 Capulet Cir
- 33937 Tybalt Ct
- 33940 Capulet Cir
- 33933 Tybalt Ct
- 33932 Tybalt Ct
- 33928 Tybalt Ct
- 33944 Juliet Cir
- 33940 Juliet Cir
- 33936 Capulet Cir
- 33936 Juliet Cir
- 33929 Tybalt Ct
- 33932 Juliet Cir
- 33924 Tybalt Ct
- 33956 Capulet Cir
- 33925 Tybalt Ct
- 33928 Juliet Cir
- 33920 Tybalt Ct
- 33960 Capulet Cir
- 33921 Tybalt Ct
- 33924 Juliet Cir