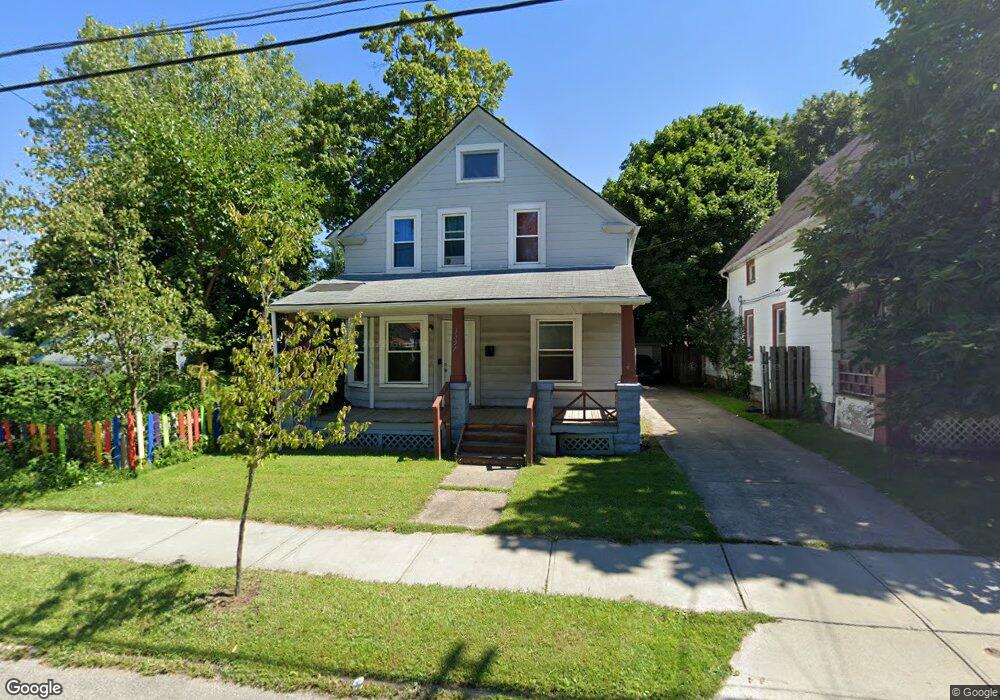
3397 W 63rd St Cleveland, OH 44102
Stockyards NeighborhoodEstimated Value: $81,366 - $108,000
4
Beds
1
Bath
1,430
Sq Ft
$65/Sq Ft
Est. Value
About This Home
This home is located at 3397 W 63rd St, Cleveland, OH 44102 and is currently estimated at $93,592, approximately $65 per square foot. 3397 W 63rd St is a home located in Cuyahoga County with nearby schools including Almira Academy, Benjamin Franklin, and Artemus Ward School.
Ownership History
Date
Name
Owned For
Owner Type
Purchase Details
Closed on
Apr 13, 2018
Sold by
Us Bank Na
Bought by
Fausnaugh Andrew S
Current Estimated Value
Purchase Details
Closed on
Feb 1, 2017
Sold by
Kosman Patty M
Bought by
Us Bank Na
Purchase Details
Closed on
Aug 23, 2002
Sold by
Rysar Properties Inc
Bought by
Kosman Patty M
Home Financials for this Owner
Home Financials are based on the most recent Mortgage that was taken out on this home.
Original Mortgage
$73,486
Interest Rate
6.63%
Mortgage Type
FHA
Purchase Details
Closed on
Aug 29, 2001
Sold by
Kansa Steve
Bought by
Rysar Properties Inc
Home Financials for this Owner
Home Financials are based on the most recent Mortgage that was taken out on this home.
Original Mortgage
$600,000
Interest Rate
7.11%
Purchase Details
Closed on
May 23, 2001
Sold by
Chevalier Earl C
Bought by
Kansa Steve
Purchase Details
Closed on
Mar 25, 1981
Sold by
Chevalier Dorothy
Bought by
Chevalier Earl C
Purchase Details
Closed on
Jan 1, 1975
Bought by
Chevalier Dorothy
Create a Home Valuation Report for This Property
The Home Valuation Report is an in-depth analysis detailing your home's value as well as a comparison with similar homes in the area
Home Values in the Area
Average Home Value in this Area
Purchase History
| Date | Buyer | Sale Price | Title Company |
|---|---|---|---|
| Fausnaugh Andrew S | $20,000 | Intitle Agency Inc | |
| Us Bank Na | $32,400 | None Available | |
| Kosman Patty M | $87,400 | Equity Title Agency Inc | |
| Rysar Properties Inc | $243,500 | Equity Title Agency Inc | |
| Kansa Steve | $7,500 | Quality Title Agency Inc | |
| Chevalier Earl C | -- | -- | |
| Chevalier Dorothy | -- | -- |
Source: Public Records
Mortgage History
| Date | Status | Borrower | Loan Amount |
|---|---|---|---|
| Previous Owner | Kosman Patty M | $73,486 | |
| Previous Owner | Rysar Properties Inc | $600,000 | |
| Closed | Kosman Patty M | $15,000 |
Source: Public Records
Tax History Compared to Growth
Tax History
| Year | Tax Paid | Tax Assessment Tax Assessment Total Assessment is a certain percentage of the fair market value that is determined by local assessors to be the total taxable value of land and additions on the property. | Land | Improvement |
|---|---|---|---|---|
| 2024 | $1,070 | $15,995 | $5,635 | $10,360 |
| 2023 | $1,164 | $15,020 | $3,150 | $11,870 |
| 2022 | $1,158 | $15,020 | $3,150 | $11,870 |
| 2021 | $1,147 | $15,020 | $3,150 | $11,870 |
| 2020 | $1,021 | $11,550 | $2,420 | $9,140 |
| 2019 | $946 | $33,000 | $6,900 | $26,100 |
| 2018 | $943 | $11,550 | $2,420 | $9,140 |
| 2017 | $1,157 | $13,690 | $1,510 | $12,180 |
| 2016 | $2,184 | $13,690 | $1,510 | $12,180 |
| 2015 | $1,351 | $13,690 | $1,510 | $12,180 |
| 2014 | $1,351 | $16,450 | $1,680 | $14,770 |
Source: Public Records
Map
Nearby Homes
- 3412 W 63rd St
- 6412 Storer Ave
- 3442 W 60th St
- 3426 W 65th St
- 3328 W 61st St
- 3477 W 63rd St
- 3500 W 62nd St
- 3297 W 61st St
- 3514 W 58th St
- 5628 Pacific Ave
- 3250 W 61st St
- 3336 W 54th St
- 3326 W 54th St
- 3306 W 52nd St
- 3256 W 54th St
- 3325 W 52nd St
- 6007 Frontier Ave
- 7104 Dearborn Ave
- 3420 W 49th St
- 3206 W 71st St
- 3405 W 63rd St
- 3412 W 62nd St
- 3416 W 62nd St
- 3413 W 63rd St
- 3404 W 62nd St
- 3420 W 62nd St
- 3408 W 62nd St
- 3394 W 63rd St
- 3402 W 63rd St
- 3400 W 62nd St
- 3424 W 62nd St
- 3398 W 63rd St
- 3417 W 63rd St
- 3408 W 63rd St
- 3384 W 63rd St
- 3384 W 63rd St Unit 1
- 3428 W 62nd St
- 6325 Storer Ave
- 3421 W 63rd St
- 3414 W 63rd St