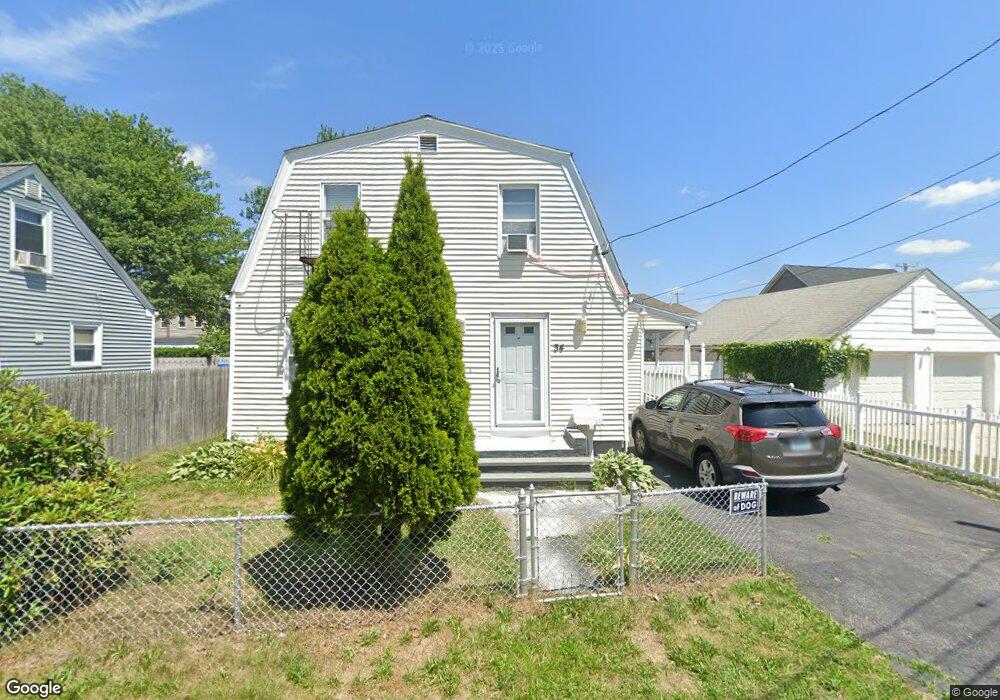
34 Aiken St Pawtucket, RI 02861
Darlington NeighborhoodEstimated Value: $431,010 - $529,000
5
Beds
2
Baths
1,921
Sq Ft
$257/Sq Ft
Est. Value
About This Home
This home is located at 34 Aiken St, Pawtucket, RI 02861 and is currently estimated at $494,253, approximately $257 per square foot. 34 Aiken St is a home located in Providence County with nearby schools including St Cecilia School and Saint Raphael Academy.
Ownership History
Date
Name
Owned For
Owner Type
Purchase Details
Closed on
Aug 6, 2001
Sold by
Leite Peter G
Bought by
Lemus Maria D and Sanabria Carlos I
Current Estimated Value
Home Financials for this Owner
Home Financials are based on the most recent Mortgage that was taken out on this home.
Original Mortgage
$128,250
Interest Rate
7.14%
Purchase Details
Closed on
Nov 24, 1993
Sold by
Haddad Edmond A and Haddad Alexandra
Bought by
Leite Peter G
Create a Home Valuation Report for This Property
The Home Valuation Report is an in-depth analysis detailing your home's value as well as a comparison with similar homes in the area
Home Values in the Area
Average Home Value in this Area
Purchase History
| Date | Buyer | Sale Price | Title Company |
|---|---|---|---|
| Lemus Maria D | $135,000 | -- | |
| Leite Peter G | $100,000 | -- |
Source: Public Records
Mortgage History
| Date | Status | Borrower | Loan Amount |
|---|---|---|---|
| Open | Leite Peter G | $35,000 | |
| Open | Leite Peter G | $145,000 | |
| Closed | Leite Peter G | $128,250 |
Source: Public Records
Tax History Compared to Growth
Tax History
| Year | Tax Paid | Tax Assessment Tax Assessment Total Assessment is a certain percentage of the fair market value that is determined by local assessors to be the total taxable value of land and additions on the property. | Land | Improvement |
|---|---|---|---|---|
| 2025 | $5,182 | $394,100 | $124,700 | $269,400 |
| 2024 | $4,863 | $394,100 | $124,700 | $269,400 |
| 2023 | $4,547 | $268,400 | $78,000 | $190,400 |
| 2022 | $4,450 | $268,400 | $78,000 | $190,400 |
| 2021 | $4,450 | $268,400 | $78,000 | $190,400 |
| 2020 | $4,105 | $196,500 | $61,600 | $134,900 |
| 2019 | $4,105 | $196,500 | $61,600 | $134,900 |
| 2018 | $3,956 | $196,500 | $61,600 | $134,900 |
| 2017 | $3,324 | $146,300 | $50,800 | $95,500 |
| 2016 | $3,203 | $146,300 | $50,800 | $95,500 |
| 2015 | $3,203 | $146,300 | $50,800 | $95,500 |
| 2014 | $3,182 | $138,000 | $50,800 | $87,200 |
Source: Public Records
Map
Nearby Homes