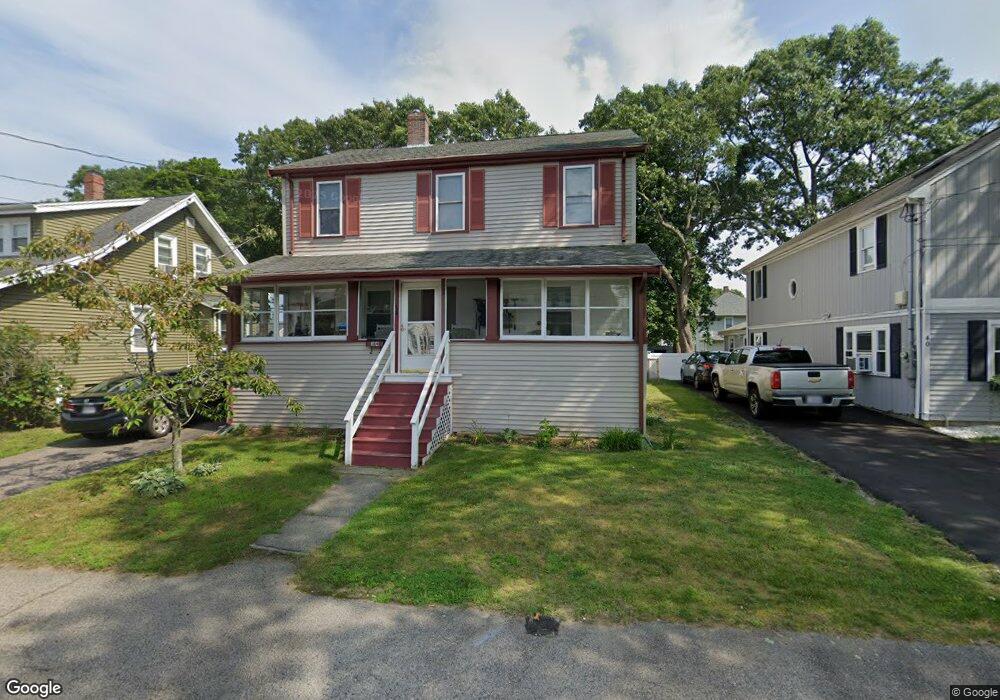
34 Bickford Rd Braintree, MA 02184
East Braintree NeighborhoodEstimated Value: $587,000 - $707,000
2
Beds
2
Baths
1,680
Sq Ft
$383/Sq Ft
Est. Value
About This Home
This home is located at 34 Bickford Rd, Braintree, MA 02184 and is currently estimated at $644,116, approximately $383 per square foot. 34 Bickford Rd is a home located in Norfolk County with nearby schools including Braintree High School, Sacred Heart Elementary School, and South Shore Christian Academy.
Ownership History
Date
Name
Owned For
Owner Type
Purchase Details
Closed on
Nov 13, 1998
Sold by
Hoey John M
Bought by
Folan Colman P and Colman Joanne
Current Estimated Value
Home Financials for this Owner
Home Financials are based on the most recent Mortgage that was taken out on this home.
Original Mortgage
$40,000
Interest Rate
6.65%
Mortgage Type
Purchase Money Mortgage
Purchase Details
Closed on
Dec 17, 1990
Sold by
Malkos Theodore J
Bought by
Hoey John M
Home Financials for this Owner
Home Financials are based on the most recent Mortgage that was taken out on this home.
Original Mortgage
$108,700
Interest Rate
10.07%
Mortgage Type
Purchase Money Mortgage
Create a Home Valuation Report for This Property
The Home Valuation Report is an in-depth analysis detailing your home's value as well as a comparison with similar homes in the area
Home Values in the Area
Average Home Value in this Area
Purchase History
| Date | Buyer | Sale Price | Title Company |
|---|---|---|---|
| Folan Colman P | $137,200 | -- | |
| Hoey John M | $114,500 | -- | |
| Hoey John M | $114,500 | -- |
Source: Public Records
Mortgage History
| Date | Status | Borrower | Loan Amount |
|---|---|---|---|
| Open | Hoey John M | $113,000 | |
| Closed | Hoey John M | $40,000 | |
| Previous Owner | Hoey John M | $108,700 |
Source: Public Records
Tax History Compared to Growth
Tax History
| Year | Tax Paid | Tax Assessment Tax Assessment Total Assessment is a certain percentage of the fair market value that is determined by local assessors to be the total taxable value of land and additions on the property. | Land | Improvement |
|---|---|---|---|---|
| 2025 | $6,112 | $612,400 | $318,200 | $294,200 |
| 2024 | $5,489 | $579,000 | $296,700 | $282,300 |
| 2023 | $5,213 | $534,100 | $266,600 | $267,500 |
| 2022 | $5,058 | $508,300 | $240,800 | $267,500 |
| 2021 | $4,679 | $470,300 | $217,600 | $252,700 |
| 2020 | $4,442 | $450,500 | $197,800 | $252,700 |
| 2019 | $4,180 | $414,300 | $189,200 | $225,100 |
| 2018 | $4,093 | $388,300 | $172,000 | $216,300 |
| 2017 | $3,982 | $370,800 | $163,400 | $207,400 |
| 2016 | $3,659 | $333,200 | $137,600 | $195,600 |
| 2015 | $3,588 | $324,100 | $135,900 | $188,200 |
| 2014 | $3,411 | $298,700 | $123,800 | $174,900 |
Source: Public Records
Map
Nearby Homes
- 83 Edgemont Rd
- 67 Somerville Ave
- 60 Edgehill Rd
- 64 Arborway Dr
- 33 Argyle Rd
- 141 Hobart St
- 141 Commercial St Unit 9
- 145 Commercial St Unit 3
- 171 Hayward St
- 155 Audubon Ave
- 21 Faxon St
- 36 Brookside Rd
- 294 Commercial St
- 17 Worster Terrace
- 31 Tingley Rd
- 211 Glenrose Ave
- 51 Faxon St
- 39 Dobson Rd
- 685 Union St
- 122 Washington St Unit 22