34 Boiling Spring Ave Westerly, RI 02891
Estimated Value: $426,715 - $473,000
About This Home
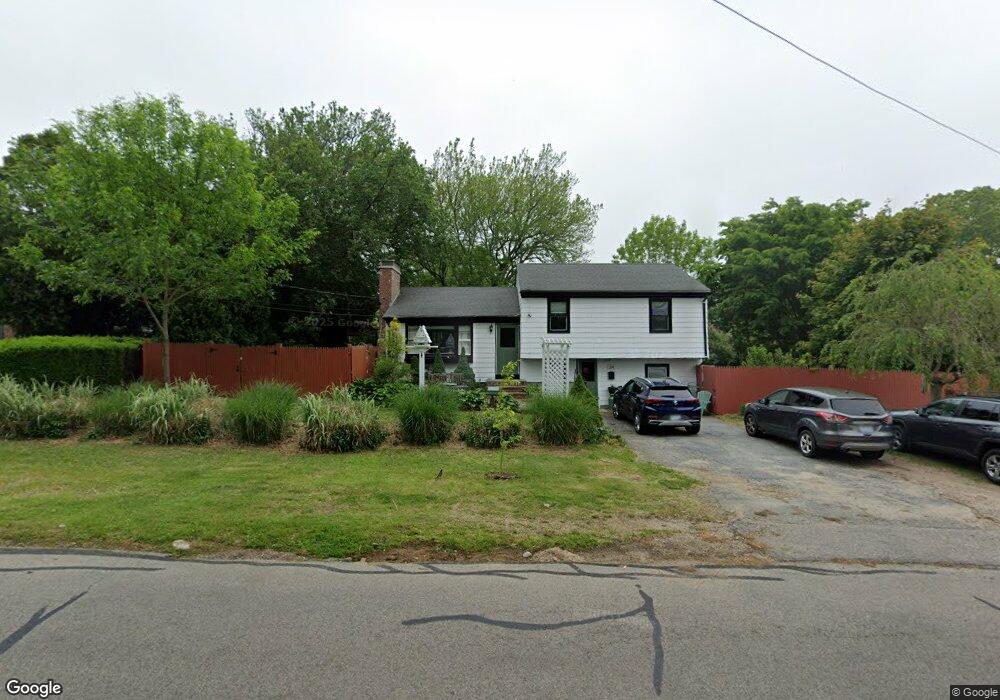
This home is located at 34 Boiling Spring Ave, Westerly, RI 02891 and is currently estimated at $457,679, approximately $373 per square foot. 34 Boiling Spring Ave is a home located in Washington County with nearby schools including Westerly High School and St. Michael School.
Ownership History
We collect this data history from publicly available records. To have your information removed, we recommend requesting removal directly through your county’s website.
Purchase Details
Purchase Details
Home Values in the Area
Average Home Value in this Area
Purchase History
We collect this data history from publicly available records. To have your information removed, we recommend requesting removal directly through your county’s website.
| Date | Buyer | Sale Price | Title Company |
|---|---|---|---|
| -- | -- | ||
| $110,000 | -- |
Mortgage History
We collect this data history from publicly available records. To have your information removed, we recommend requesting removal directly through your county’s website.
| Date | Status | Borrower | Loan Amount |
|---|---|---|---|
| Previous Owner | $211,000 | ||
| Previous Owner | $210,000 | ||
| Previous Owner | $180,000 |
Tax History
We collect this data history from publicly available records. To have your information removed, we recommend requesting removal directly through your county’s website.
| Year | Tax Paid | Tax Assessment Tax Assessment Total Assessment is a certain percentage of the fair market value that is determined by local assessors to be the total taxable value of land and additions on the property. | Land | Improvement |
|---|---|---|---|---|
| 2025 | $2,812 | $361,500 | $164,800 | $196,700 |
| 2024 | $2,812 | $269,100 | $117,700 | $151,400 |
| 2023 | $2,734 | $269,100 | $117,700 | $151,400 |
| 2022 | $2,718 | $269,100 | $117,700 | $151,400 |
| 2021 | $2,504 | $207,600 | $102,400 | $105,200 |
| 2020 | $2,460 | $207,600 | $102,400 | $105,200 |
| 2019 | $2,437 | $207,600 | $102,400 | $105,200 |
| 2018 | $2,443 | $197,800 | $102,400 | $95,400 |
| 2017 | $2,374 | $197,800 | $102,400 | $95,400 |
| 2016 | $2,374 | $197,800 | $102,400 | $95,400 |
| 2015 | $2,174 | $193,600 | $104,500 | $89,100 |
| 2014 | $2,139 | $193,600 | $104,500 | $89,100 |
Map
- 9 Apache Dr Unit D
- 36 Ledward Ave
- 19 Apache Dr Unit F
- 15 Blue Heron Dr
- 2 Marichris Dr
- 42 Westminster St
- 38 School St
- 21 North Dr
- 23 Newton Ave
- 6 Wilder Ave
- 23 Abbey Ln Unit 12
- 35 Post Rd
- 24 Abbey Ln Unit 13
- 145 High St Unit C
- 40 Pound Rd
- 17 West St Unit 3
- 14 Meadow Lark Dr
- 166 High St
- 21 Chase St
- 177 High St
- 36 Boiling Spring Ave
- 36 Boiling Springs Ave
- 39 Boiling Spring Ave
- 5 Clay Ln
- 4 Clay Ln
- 37 Boiling Spring Ave
- 38 Boiling Spring Ave
- 35 Boiling Spring Ave
- 2 Chord St
- 40 Boiling Spring Ave
- 3 Chord St
- 4 Atlas St
- 6 Clay Ln
- 1 Atlas St
- 10 Clay Ln
- 32 Boiling Spring Ave
- 11 Clay Ln
- 4 Chord St
- 5 Chord St
- 31 Boiling Spring Ave
Ask me questions while you tour the home.