
Seller's Agent in 2025
Beatrice Murphy
Lamacchia Realty, Inc.
(617) 733-6382
3 in this area
252 Total Sales
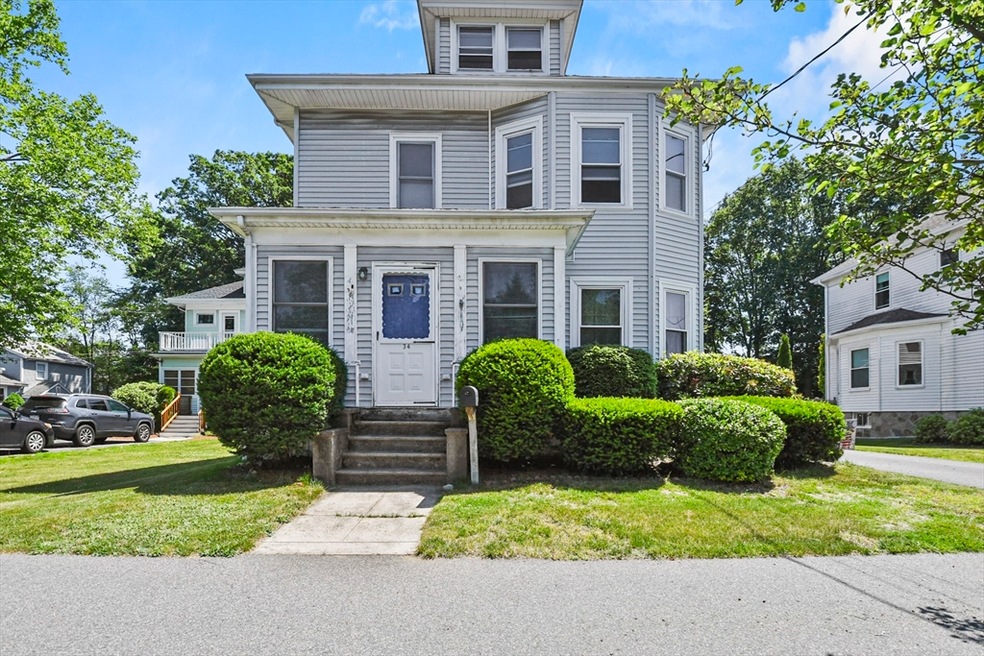


Welcome to your new spacious multifamily at 34 Bouve with brand new updated decking! This home sits on a spacious lot with ample backyard space, and a two car detached garage. Make your way inside to the first floor with dining space in the middle of the unit and all rooms off of the centered dining space including updated kitchen, pantry, and two bedrooms and full bathroom. Second floor is a mirror image of the first floor, but has no fridge or oven and a shared bathroom between the two bedrooms. Third floor has no stove, and access to two staircases for front and back entry. Water heater was replaced in 2019, roof is roughly 7-10 years old, and each unit has their own panels. There is also additional deck access between the 2nd and 3rd floors.
| Date | Type | Sale Price | Title Company |
|---|---|---|---|
| Quit Claim Deed | $750,000 | -- | |
| Deed | $750,000 | -- | |
| Deed | $180,000 | -- | |
| Deed | $180,000 | -- |
| Date | Status | Loan Amount | Loan Type |
|---|---|---|---|
| Open | $712,500 | New Conventional | |
| Closed | $712,500 | New Conventional | |
| Previous Owner | $148,000 | No Value Available | |
| Previous Owner | $157,500 | No Value Available | |
| Previous Owner | $162,000 | Purchase Money Mortgage |
| Date | Event | Price | List to Sale | Price per Sq Ft |
|---|---|---|---|---|
| 08/08/2025 08/08/25 | Sold | $750,000 | 0.0% | $298 / Sq Ft |
| 06/24/2025 06/24/25 | Pending | -- | -- | -- |
| 06/18/2025 06/18/25 | For Sale | $750,000 | -- | $298 / Sq Ft |
| Year | Tax Paid | Tax Assessment Tax Assessment Total Assessment is a certain percentage of the fair market value that is determined by local assessors to be the total taxable value of land and additions on the property. | Land | Improvement |
|---|---|---|---|---|
| 2025 | $7,578 | $625,800 | $140,900 | $484,900 |
| 2024 | $7,217 | $600,400 | $140,900 | $459,500 |
| 2023 | $6,881 | $530,100 | $108,200 | $421,900 |
| 2022 | $6,565 | $469,900 | $98,400 | $371,500 |
| 2021 | $4,136 | $426,100 | $82,500 | $343,600 |
| 2020 | $5,442 | $359,200 | $76,500 | $282,700 |
| 2019 | $5,500 | $353,900 | $74,400 | $279,500 |
| 2018 | $5,407 | $336,700 | $74,400 | $262,300 |
| 2017 | $4,898 | $304,200 | $74,400 | $229,800 |
| 2016 | $4,206 | $242,300 | $72,400 | $169,900 |
| 2015 | $3,370 | $185,700 | $72,400 | $113,300 |
| 2014 | $3,224 | $177,800 | $72,400 | $105,400 |
Seller's Agent in 2025
Beatrice Murphy
Lamacchia Realty, Inc.
(617) 733-6382
3 in this area
252 Total Sales
I
Buyer's Agent in 2025
Isabel Altaf
eXp Realty
1 in this area
6 Total Sales
Source: MLS Property Information Network (MLS PIN)
MLS Number: 73392820
APN: BROC-000067-000066
Disclaimer: Certain information contained herein is derived from information provided by parties other than Homes.com. All information provided is deemed reliable, but is not guaranteed to be accurate and should be independently verified.
![]() The property listing data and information, or the Images, set forth herein were provided to MLS Property Information Network, Inc. from third party sources, including sellers, lessors and public records, and were compiled by MLS Property Information Network, Inc. The property listing data and information, and the Images, are for the personal, non-commercial use of consumers having a good faith interest in purchasing or leasing listed properties of the type displayed to them and may not be used for any purpose other than to identify prospective properties which such consumers may have a good faith interest in purchasing or leasing. MLS Property Information Network, Inc. and its subscribers disclaim any and all representations and warranties as to the accuracy of the property listing data and information, or as to the accuracy of any of the Images, set forth herein.
The property listing data and information, or the Images, set forth herein were provided to MLS Property Information Network, Inc. from third party sources, including sellers, lessors and public records, and were compiled by MLS Property Information Network, Inc. The property listing data and information, and the Images, are for the personal, non-commercial use of consumers having a good faith interest in purchasing or leasing listed properties of the type displayed to them and may not be used for any purpose other than to identify prospective properties which such consumers may have a good faith interest in purchasing or leasing. MLS Property Information Network, Inc. and its subscribers disclaim any and all representations and warranties as to the accuracy of the property listing data and information, or as to the accuracy of any of the Images, set forth herein.
Ask me questions while you tour the home.