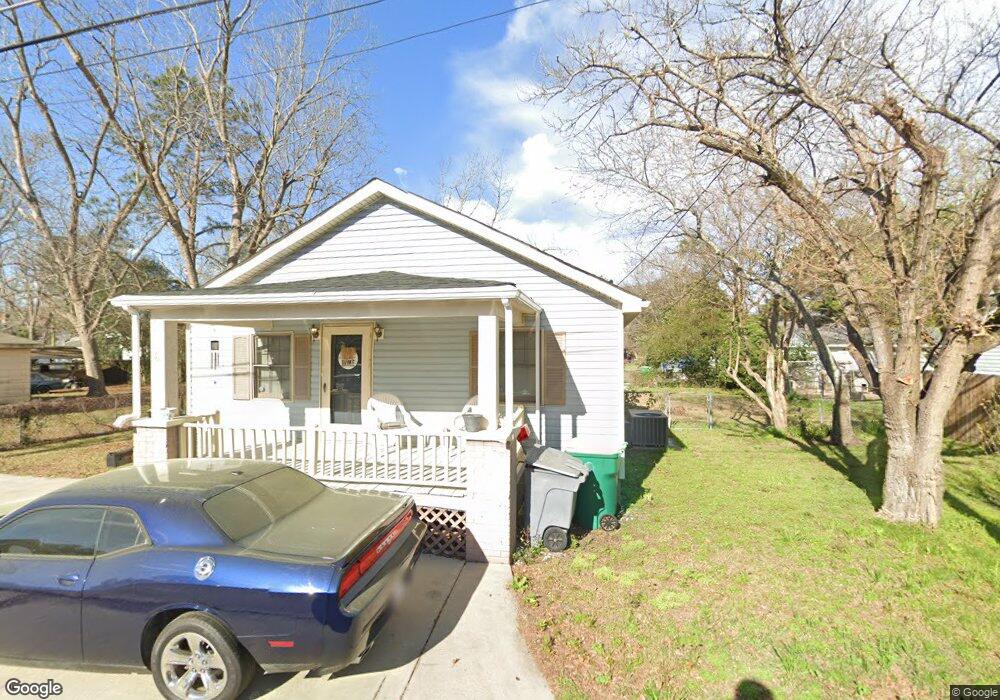
34 Bradford St Lumberton, NC 28358
Estimated Value: $42,000 - $79,000
2
Beds
1
Bath
718
Sq Ft
$95/Sq Ft
Est. Value
About This Home
This home is located at 34 Bradford St, Lumberton, NC 28358 and is currently estimated at $68,302, approximately $95 per square foot. 34 Bradford St is a home located in Robeson County with nearby schools including Tanglewood Elementary School, Parkton Elementary School, and L. Gilbert Carroll Middle School.
Ownership History
Date
Name
Owned For
Owner Type
Purchase Details
Closed on
Sep 28, 2020
Sold by
Oxendine Kim Dial and Locklear Katrina N
Bought by
Locklear Katrina N
Current Estimated Value
Purchase Details
Closed on
May 31, 2012
Sold by
Jones Valarie A and Hammond Joshua
Bought by
Oxendine Kim Dial and Locklear Katrina N
Home Financials for this Owner
Home Financials are based on the most recent Mortgage that was taken out on this home.
Original Mortgage
$51,941
Outstanding Balance
$36,944
Interest Rate
4.4%
Mortgage Type
FHA
Estimated Equity
$31,358
Create a Home Valuation Report for This Property
The Home Valuation Report is an in-depth analysis detailing your home's value as well as a comparison with similar homes in the area
Home Values in the Area
Average Home Value in this Area
Purchase History
| Date | Buyer | Sale Price | Title Company |
|---|---|---|---|
| Locklear Katrina N | -- | Servicelink | |
| Oxendine Kim Dial | $53,000 | None Available |
Source: Public Records
Mortgage History
| Date | Status | Borrower | Loan Amount |
|---|---|---|---|
| Open | Oxendine Kim Dial | $51,941 |
Source: Public Records
Tax History Compared to Growth
Tax History
| Year | Tax Paid | Tax Assessment Tax Assessment Total Assessment is a certain percentage of the fair market value that is determined by local assessors to be the total taxable value of land and additions on the property. | Land | Improvement |
|---|---|---|---|---|
| 2025 | $476 | $52,800 | $5,500 | $47,300 |
| 2024 | $471 | $52,800 | $5,500 | $47,300 |
| 2023 | $364 | $38,500 | $5,000 | $33,500 |
| 2022 | $364 | $38,500 | $5,000 | $33,500 |
| 2021 | $364 | $38,500 | $5,000 | $33,500 |
| 2020 | $349 | $38,500 | $5,000 | $33,500 |
| 2018 | $356 | $29,600 | $5,000 | $24,600 |
| 2017 | $288 | $29,600 | $5,000 | $24,600 |
| 2016 | $288 | $29,600 | $5,000 | $24,600 |
| 2015 | $288 | $29,600 | $5,000 | $24,600 |
| 2014 | $288 | $29,600 | $5,000 | $24,600 |
Source: Public Records
Map
Nearby Homes