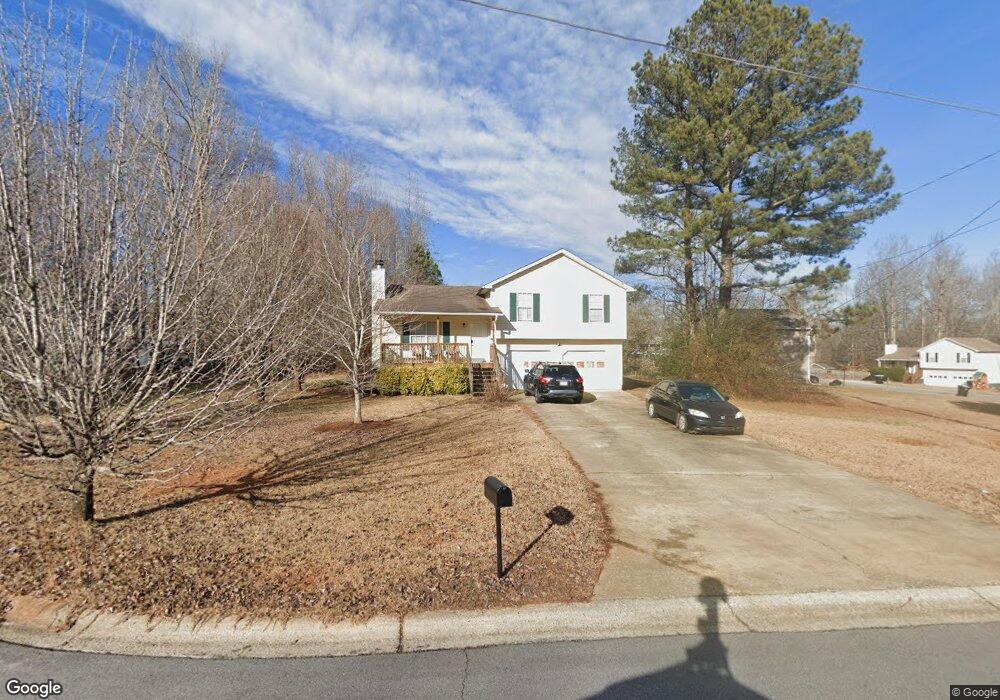
34 Canter Ln Dallas, GA 30157
Estimated Value: $249,000 - $263,000
--
Bed
2
Baths
1,104
Sq Ft
$231/Sq Ft
Est. Value
About This Home
This home is located at 34 Canter Ln, Dallas, GA 30157 and is currently estimated at $254,826, approximately $230 per square foot. 34 Canter Ln is a home located in Paulding County with nearby schools including Union Elementary School, Carl Scoggins Sr. Middle School, and South Paulding High School.
Ownership History
Date
Name
Owned For
Owner Type
Purchase Details
Closed on
Jun 18, 2020
Sold by
Baf 2 Llc
Bought by
Baf Assets Llc
Current Estimated Value
Purchase Details
Closed on
Aug 7, 2012
Sold by
Lumsden Jessica Martin
Bought by
Colfin Ai Ga 1 Llc
Purchase Details
Closed on
Aug 31, 2006
Sold by
Mayfield Michael L
Bought by
Lumsden Michael and Lumsden Jessica M
Home Financials for this Owner
Home Financials are based on the most recent Mortgage that was taken out on this home.
Original Mortgage
$111,200
Interest Rate
7.75%
Mortgage Type
New Conventional
Purchase Details
Closed on
Aug 30, 2001
Sold by
Peyco Construction Inc
Bought by
Mayfield Michael L
Home Financials for this Owner
Home Financials are based on the most recent Mortgage that was taken out on this home.
Original Mortgage
$85,600
Interest Rate
6.74%
Mortgage Type
FHA
Create a Home Valuation Report for This Property
The Home Valuation Report is an in-depth analysis detailing your home's value as well as a comparison with similar homes in the area
Home Values in the Area
Average Home Value in this Area
Purchase History
| Date | Buyer | Sale Price | Title Company |
|---|---|---|---|
| Baf Assets Llc | $2,001,589 | -- | |
| Colfin Ai Ga 1 Llc | $50,000 | -- | |
| Lumsden Michael | $111,200 | -- | |
| Mayfield Michael L | $87,000 | -- |
Source: Public Records
Mortgage History
| Date | Status | Borrower | Loan Amount |
|---|---|---|---|
| Previous Owner | Lumsden Michael | $111,200 | |
| Previous Owner | Mayfield Michael L | $85,600 |
Source: Public Records
Tax History Compared to Growth
Tax History
| Year | Tax Paid | Tax Assessment Tax Assessment Total Assessment is a certain percentage of the fair market value that is determined by local assessors to be the total taxable value of land and additions on the property. | Land | Improvement |
|---|---|---|---|---|
| 2024 | $2,445 | $98,296 | $12,000 | $86,296 |
| 2023 | $1,446 | $55,447 | $6,922 | $48,525 |
| 2022 | $1,446 | $55,447 | $6,922 | $48,525 |
| 2021 | $1,611 | $64,080 | $8,000 | $56,080 |
| 2020 | $1,508 | $59,160 | $8,000 | $51,160 |
| 2019 | $1,643 | $54,520 | $8,000 | $46,520 |
| 2018 | $1,099 | $46,720 | $8,000 | $38,720 |
| 2017 | $1,221 | $39,960 | $6,000 | $33,960 |
| 2016 | $1,058 | $35,000 | $6,000 | $29,000 |
| 2015 | $957 | $31,080 | $6,000 | $25,080 |
| 2014 | $561 | $17,780 | $6,000 | $11,780 |
| 2013 | -- | $13,320 | $6,000 | $7,320 |
Source: Public Records
Map
Nearby Homes
- 370 Buchanan Cir Unit TRACT 1
- 370 Buchanan Circle Tract 1
- 177 Rustin Dr
- 0 Rustin Dr Unit 10617842
- 0 Rustin Dr Unit 7657021
- 128 Tanner Dr
- 8713 Buchanan Hwy
- 453 Mulberry Rock Rd
- 391 Mulberry Rock Rd
- 34 Harmony Ridge Dr
- 0 Old Yorkville Rd Unit 10574003
- 877 Georgia 101
- 8277 Buchanan Hwy
- 281 Harmony Woods Dr
- 292 Harmony Woods Dr
- 270 Harmony Woods Dr
- 216 Lake Tanisha Dr
- 728 Harmony Rd
- 723 Mulberry Rock Rd
- 703 Mulberry Rock Rd