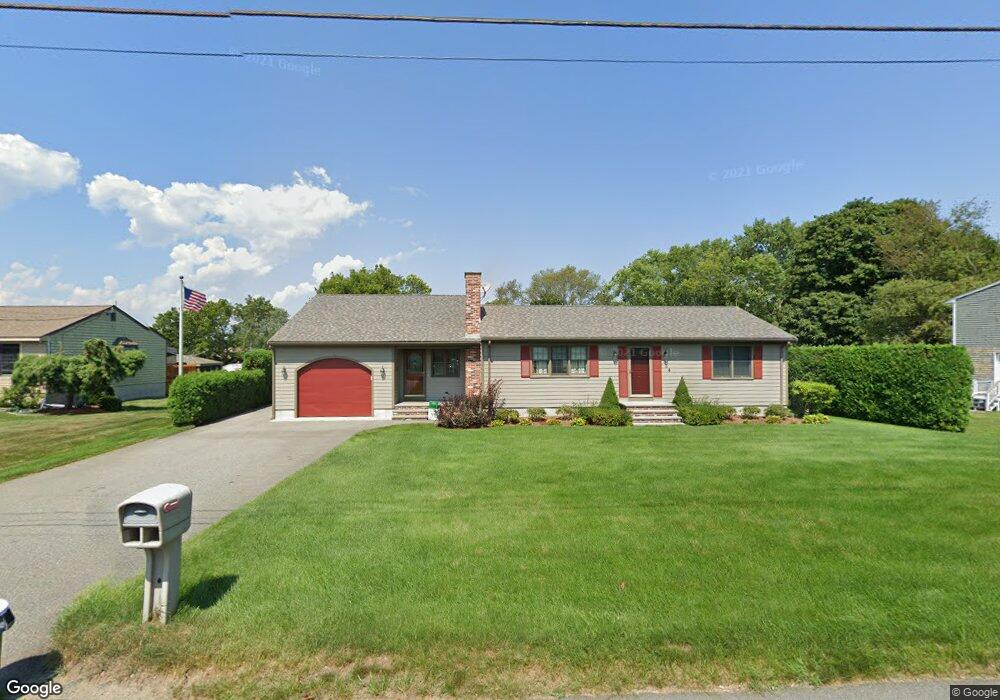
34 Compos St Somerset, MA 02726
Somerset Historic Village NeighborhoodEstimated Value: $396,000 - $533,000
2
Beds
1
Bath
1,164
Sq Ft
$412/Sq Ft
Est. Value
About This Home
This home is located at 34 Compos St, Somerset, MA 02726 and is currently estimated at $479,185, approximately $411 per square foot. 34 Compos St is a home located in Bristol County with nearby schools including North Elementary School and Somerset Middle School.
Ownership History
Date
Name
Owned For
Owner Type
Purchase Details
Closed on
Jul 2, 2024
Sold by
Dionne Donald M and Dionne Eileen
Bought by
D M & Eileen Dionne Irt and Dionne
Current Estimated Value
Purchase Details
Closed on
Jun 8, 1984
Bought by
Dionne Donald M
Create a Home Valuation Report for This Property
The Home Valuation Report is an in-depth analysis detailing your home's value as well as a comparison with similar homes in the area
Home Values in the Area
Average Home Value in this Area
Purchase History
| Date | Buyer | Sale Price | Title Company |
|---|---|---|---|
| D M & Eileen Dionne Irt | -- | None Available | |
| D M & Eileen Dionne Irt | -- | None Available | |
| D M & Eileen Dionne Irt | -- | None Available | |
| Dionne Donald M | $5,000 | -- |
Source: Public Records
Mortgage History
| Date | Status | Borrower | Loan Amount |
|---|---|---|---|
| Previous Owner | Dionne Donald M | $50,000 | |
| Previous Owner | Dionne Donald M | $34,300 | |
| Previous Owner | Dionne Donald M | $15,000 | |
| Previous Owner | Dionne Donald M | $8,500 |
Source: Public Records
Tax History Compared to Growth
Tax History
| Year | Tax Paid | Tax Assessment Tax Assessment Total Assessment is a certain percentage of the fair market value that is determined by local assessors to be the total taxable value of land and additions on the property. | Land | Improvement |
|---|---|---|---|---|
| 2025 | $6,679 | $502,200 | $190,700 | $311,500 |
| 2024 | $6,211 | $485,600 | $190,700 | $294,900 |
| 2023 | $5,435 | $428,600 | $166,000 | $262,600 |
| 2022 | $5,045 | $379,600 | $144,600 | $235,000 |
| 2021 | $5,098 | $347,300 | $131,500 | $215,800 |
| 2020 | $5,020 | $329,800 | $131,500 | $198,300 |
| 2019 | $5,658 | $310,000 | $131,500 | $178,500 |
| 2018 | $5,047 | $297,600 | $131,500 | $166,100 |
| 2017 | $4,924 | $283,000 | $125,500 | $157,500 |
| 2016 | $4,955 | $283,000 | $125,500 | $157,500 |
| 2015 | $4,606 | $265,500 | $119,900 | $145,600 |
| 2014 | $6,335 | $262,300 | $116,500 | $145,800 |
Source: Public Records
Map
Nearby Homes