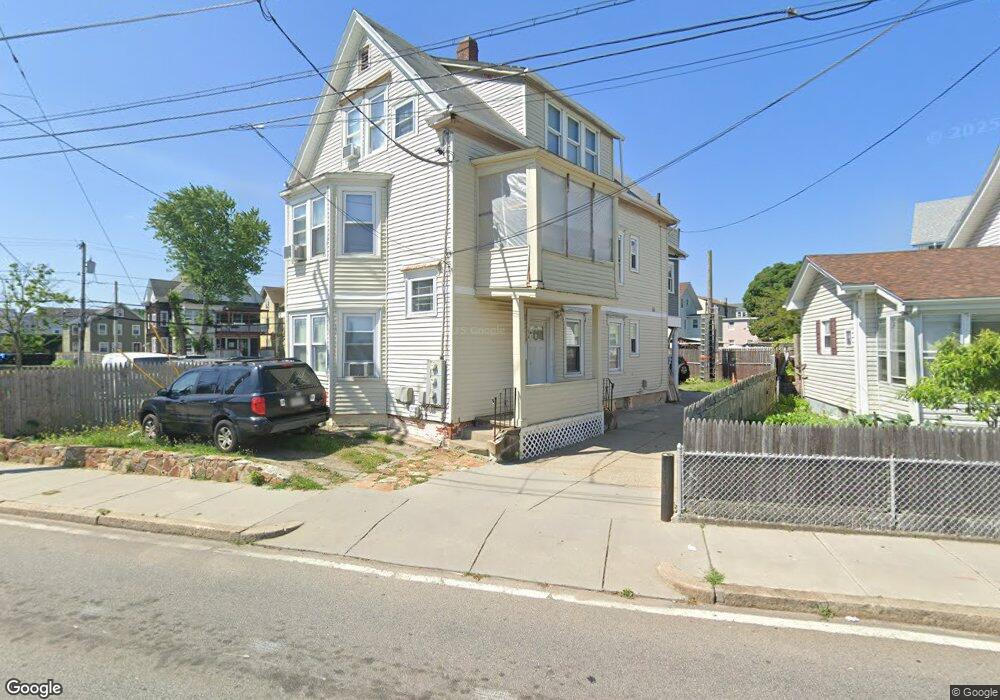
34 Conant St Pawtucket, RI 02860
Downtown Pawtucket NeighborhoodEstimated Value: $377,520 - $615,000
6
Beds
3
Baths
2,244
Sq Ft
$239/Sq Ft
Est. Value
About This Home
This home is located at 34 Conant St, Pawtucket, RI 02860 and is currently estimated at $535,630, approximately $238 per square foot. 34 Conant St is a home located in Providence County with nearby schools including International Charter School, Blackstone Valley Prep Junior High School, and Blackstone Academy Charter School.
Ownership History
Date
Name
Owned For
Owner Type
Purchase Details
Closed on
Sep 12, 2002
Sold by
Koziol Stanley P
Bought by
Pereira Joao M
Current Estimated Value
Home Financials for this Owner
Home Financials are based on the most recent Mortgage that was taken out on this home.
Original Mortgage
$116,000
Interest Rate
6.48%
Purchase Details
Closed on
Feb 15, 2002
Sold by
Cotton John M
Bought by
Koziol Stanley P
Home Financials for this Owner
Home Financials are based on the most recent Mortgage that was taken out on this home.
Original Mortgage
$106,200
Interest Rate
7.14%
Purchase Details
Closed on
Aug 1, 2001
Sold by
Faria Jeffrey R
Bought by
Cotton John M
Create a Home Valuation Report for This Property
The Home Valuation Report is an in-depth analysis detailing your home's value as well as a comparison with similar homes in the area
Home Values in the Area
Average Home Value in this Area
Purchase History
| Date | Buyer | Sale Price | Title Company |
|---|---|---|---|
| Pereira Joao M | $145,000 | -- | |
| Koziol Stanley P | $118,000 | -- | |
| Cotton John M | $74,500 | -- |
Source: Public Records
Mortgage History
| Date | Status | Borrower | Loan Amount |
|---|---|---|---|
| Open | Cotton John M | $185,600 | |
| Closed | Cotton John M | $175,500 | |
| Closed | Cotton John M | $116,000 | |
| Previous Owner | Cotton John M | $106,200 |
Source: Public Records
Tax History Compared to Growth
Tax History
| Year | Tax Paid | Tax Assessment Tax Assessment Total Assessment is a certain percentage of the fair market value that is determined by local assessors to be the total taxable value of land and additions on the property. | Land | Improvement |
|---|---|---|---|---|
| 2025 | $5,101 | $387,900 | $103,600 | $284,300 |
| 2024 | $4,787 | $387,900 | $103,600 | $284,300 |
| 2023 | $3,756 | $221,700 | $46,600 | $175,100 |
| 2022 | $3,676 | $221,700 | $46,600 | $175,100 |
| 2021 | $3,676 | $221,700 | $46,600 | $175,100 |
| 2020 | $3,159 | $151,200 | $47,200 | $104,000 |
| 2019 | $3,159 | $151,200 | $47,200 | $104,000 |
| 2018 | $3,044 | $151,200 | $47,200 | $104,000 |
| 2017 | $2,860 | $125,900 | $36,400 | $89,500 |
| 2016 | $2,756 | $125,900 | $36,400 | $89,500 |
| 2015 | $2,756 | $125,900 | $36,400 | $89,500 |
| 2014 | $2,442 | $105,900 | $46,800 | $59,100 |
Source: Public Records
Map
Nearby Homes
- 40 Conant St
- 6 Star St
- 10 Star St
- 93 Mineral Spring Ave
- 1 Star St
- 16 Star St
- 99 Mineral Spring Ave
- 9 Star St
- 13 Star St
- 22 Star St
- 70 Mineral Spring Ave
- 72 Mineral Spring Ave
- 76 Mineral Spring Ave
- 107 Mineral Spring Ave
- 80 Mineral Spring Ave
- 62 Conant St
- 21 Star St
- 26 Star St
- 90 & 100 Lafayette St
- 74 Mineral Spring Ave